0:00
In this video I'm going to show you how you can check the performance of your computer
0:05
either laptop or desktop computer. By this feature you'll be able to know what application
0:10
is eating or is using more resources like memory and even space and data
0:16
Your real-time performance of your computer as you work on as you can see here on this
0:22
desktop. So to begin to be able to achieve this first go on your toolbar
0:30
toolbar on the bottom of your screen as you can see my mouse now right click on the
0:35
tool bar select task manager now when you select task manager the task manager will open
0:46
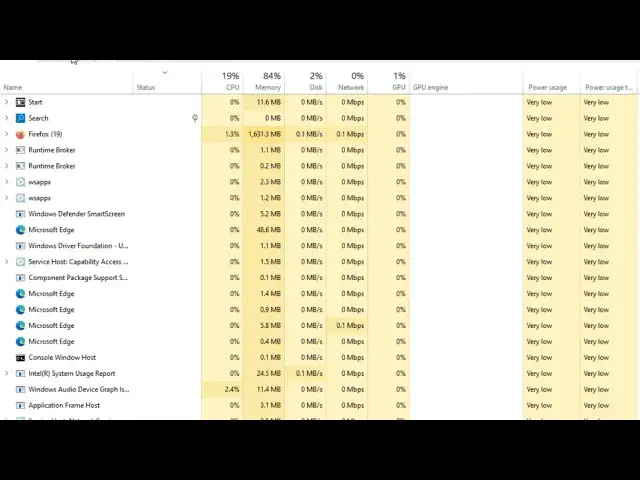
and from here you'll be able to see all the activities that are we have several
0:51
functionalities we can check like the processes you can see here what is eating the amount
0:59
of the CPU being used the memory being used the space being used the network and the CPU
1:06
percentage being used and here you can see all the programs that are running and the resources they are
1:11
using for instance Firefox here is using between 1.2 and 2% of the CPU which is 13% of all the
1:19
programs and you can see the memory the size of mb is being transferred the disk spares the network and so on and so forth Now for you to check the scale and the graph to have the graph of the performance in real time you go to performance now click on performance now when
1:39
you click on performance you will be able to see the average usage of all the programs that
1:44
are you are running in real time so currently we have the CPU usage at an average of between 20
1:51
to 30 percent and clocking at around 1.9 to 2.5 gigahertz at the moment. And all the programs that are using, you can check the memory
2:04
When we go to the memory, you can see the memory size being used is 9 and the average usage of the
2:10
memory is around 84%. Below here you can see the percentage of utilization, the percentage of speed
2:18
at which your computer is performing other parameters. And the best speed you can see is here
2:25
the sockets and all the other values that you may need to use to see although there are also the other
2:33
functions like up time are here so this is the best way to know what is eating into your
2:41
resources what is using more of your data what is using more of your memory you can be able to
2:47
see here you can also see the graph as it fluctuates and the resources that are being used
2:55
in real time. Thank you for watching, kindly subscribe and until next time. Bye bye