Up next in 10

Power BI - Table and matrix
Watch more Videos at https://www.tutorialspoint.com/videotutorials/index.htm
Lecture By: Mr. Akshay Magre, Tutorials Point India Private Limited
Show More Show Less View Video Transcript
0:00
Hello friends and welcome to Tutorials Point
0:03
In this segment of the video I'm going to show you how to create tables and metrics in PowerVi desktop
0:10
Now guys, it's not necessary that every time I create a colorful visualization I'll be able to take any kind of appropriate business decision
0:19
Sometimes there might be a scenario where we have to do a visualization in a tabular format in such a way that we can directly see the figures and take an appropriate
0:29
business decision so for the same reason we create table and matrix in power BI so guys
0:36
how to create this tables and how to create this matrix in power via desktop we'll be having a
0:41
better understanding of it in our practical approach hello friends and welcome in this
0:47
video we are going to see how to create table and matrix visualization in Power
0:52
BI so let's get started off now under the visualization pane if you go here you can
0:58
see there is a table visualization and there is a matrix visualization they are just closed next to each other so we'll start off with the table visualization
1:06
I will simply select this the moment I click on this you can see there is a blank report with right in front of me
1:13
what I need to do is I need to go ahead and add some
1:16
data to it so what we will be doing I will go under the product
1:21
table and under the product table we have created a hierarchy in which we will select all this category
1:28
category one by one that is the category column the segment column and the
1:32
manufacturer column so the moment I click on category it is showing me the list of
1:37
all the categories and then it is showing me the segments out here and in the
1:41
next column it is showing me the list of the manufacturer associated with it
1:46
now this is something very textual that means only text can be seen now I would
1:53
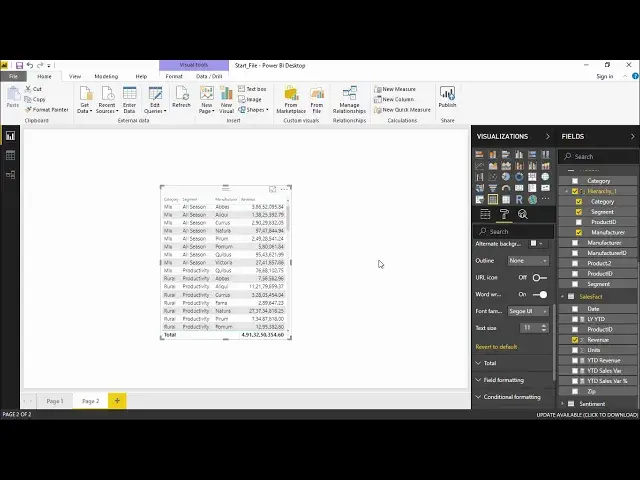
like to see the revenue as well along with it so I will go on again under the sales fact table and under the sales fact table I select this revenue and drag it here All right the moment I drop it here you can see the revenue for each and every
2:09
Manufacture along with the segment and the category can be seen in this third column now
2:14
You must be wondering that the report that we have generated is very small even if I increase the size of this particular table. It's not increasing
2:21
So how I make the changes I just have to select this a
2:25
particular table go under the format tab and under the format tab do you see there's a
2:31
value drop-down menu I simply click on it the moment I click on it I can change the
2:35
color of my values as of now I do not require that if I want to apply an
2:40
alternate font color it's totally up to you with that you want to give it and it
2:44
is giving me an option of giving a background color as well if I close
2:48
check this dialog box and let's make it little gray so automatically it is
2:53
giving a background of little grayish form in an alternate background because it's showing me alternate background color as this
3:01
I'll go ahead and select one more lighter shade all right one more okay so this is
3:08
what it looks like all right so this is looks imperfect so I have the alternate
3:12
shade colors the one thing which we are looking forward for was the text size I'll
3:15
simply go into the text size and increase this text size out here so the moment
3:19
I increase the text size you can see the text is much more visible right now all
3:24
right so this is how easy it is also the for the column headers if you can see the values are greater than the column
3:30
header name so I will go under the column headers dropped on menu and increase
3:34
its size as well right so making it much more visible for the user to check this
3:39
report out so this is what you can do under the table section where I can apply
3:43
different kind of formatting different kind of table styles all right let's go
3:48
ahead and see the table styles that we have out here if I go into the table style
3:52
as of now it is default but if I click on this drop-down menu it is giving me list of all the option that we have out here so minimal will show you the minimum background minimum formatting as we can see out here there not much of a difference I click on this drop menu I get to bold headers so I guess
4:10
my headers will get bold yeah that's what it is doing it is taking making my
4:14
head is a little bit bolder all right if I click on this drop-down menu let's
4:18
contrasting alternate rows we have contrasting alternate rows right so this is what
4:23
you can select from a bold header with flashy rows bolded with flash arrows right so you can select the any formatting that you
4:32
wish to select from this drop-down menu and get your report then and there itself
4:38
alright we'll change back to default because it's looking better than the others
4:42
right now in this I would like also like to share that what we else we can do
4:47
is in this particular table you can see if I take my cursor right out here the
4:54
cursor changes so this is to manual adjust the column size of any column right so if I want to change the column size
5:03
if I want to manually adjust it I simply have to go on this particular section
5:08
and do it manually with the help of my mouse see how that easy it is if I want to
5:14
do it an auto fit I simply have to go there and double click on it it automatically
5:19
adjust the column and get me the column width accordingly all right so this is what
5:23
I wanted to share now we'll quickly go ahead and see what are the different option that we can see in the matrix table and what is the difference between a matrix table and a normal table all right so I'll simply go ahead and create a matrix visualization all right so it is basically again a table but the only difference out here is that in this matrix I have an option where I can decide that which
5:48
what which column need to put in row and which column I need it put in column section so I will be the leader out here and I can
5:56
decide what I have to do right so if I we will quickly go ahead and create for different segments let take different segments and that should come along different rows right and I
6:09
would like to see what are the years in the columns so I'd like to see the production
6:14
or the revenue generated by different segment in different years so two things are
6:19
done the last thing which I'll be requiring is the revenue I'll take this revenue
6:23
and drag it in values the moment I drag it in values you can see there is a total
6:27
which can be seen right at the bottom and we can change it the way you want it right so it is
6:35
getting me all the piece of information right in a tabular format now this particular format is
6:44
mostly like of a pivot format which we can see in pivot tables in excel where i have different
6:51
rows with the all unique values and different columns with all unique values and their
6:56
respective revenue out of it right so simply click here and let's see what else we can do
7:02
out here in the format section in the format section i have the same general drop-down menu where
7:07
i can change the exposition y position manually with the help of these boxes also we have
7:13
matrix style out here which gives me the almost a same number of uh styles which we seen in the
7:19
previous section for our tables as well let's say take a bowl headers and write something of this sort
7:26
or I can get contrasting right contrasting alternate rows or alternate pros that's it so this is how you can create a different kind of reports in
7:37
our power BI using the minimum let's go for minimum all right so this is how
7:44
you can create a table so this is how you can create a table visualization and
7:49
matrix visualization and make the changes accordingly depending on what are the things what we would like to
7:56
show the user or the client at the time of the presentation all right guys so this was all about
8:01
this video see you until next time
#Business & Productivity Software
#Jobs & Education
#Data Sheets & Electronics Reference