Up next in 10

Power BI - Shapes text boxes and images
Watch more Videos at https://www.tutorialspoint.com/videotutorials/index.htm
Lecture By: Mr. Akshay Magre, Tutorials Point India Private Limited
Show More Show Less View Video Transcript
0:00
Hello friends and welcome to Tutorials Point
0:03
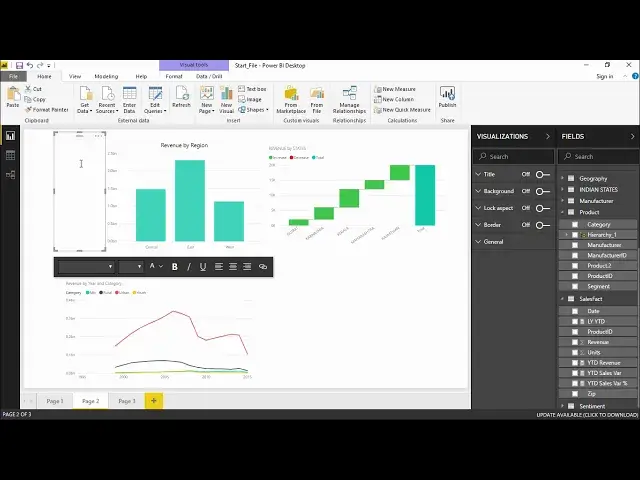
In this segment of the video, I'm going to show you how to add shapes, text and images in our visualization
0:11
Now once we have created the data bound visuals, it is sometimes necessary to include the static elements such as text box, images or any kind of shapes in our visualization
0:24
And why we need that? Let's say that I would like to pinpoint or I'd like to follow an arrow and make
0:29
the user understand that what I'm particularly showing. At that time I'll be using shapes like
0:35
arrows or some circles to highlight certain scenarios. Similarly, we can use a text box to introduce
0:43
some kind of side notes or some note along with it so that the user understand that what
0:49
the report is exactly talking about. And sometimes we also tend to use images, something like
0:55
as in company logo or that what the visual is exactly. exactly talking about at that time we'll be using the image widget as well so let's go
1:05
ahead and see how to add this static element in our power bi desktop in our
1:10
practical approach hello friends and welcome in this part of the video we are
1:16
going to see how to introduce text box images and shapes in power BI so let's get
1:22
quickly started off with that I will go under the home tab and under the home
1:26
tab you can see the insert group under the insert group under the insert group you can find a text box image and shapes out here all right we will quickly start with the text box Now you must be wondering what is the purpose and what is the use of this text box
1:40
Sometimes what happened that your projection itself, it's not self-explanatory. We need to provide some handy notes along with it so that the user who is viewing this report
1:50
should get an understanding that it is talking about something. Sometimes we do not have even headers which gives me the indication that what this report
1:58
is talking about at that instance we will be using a text box referring to a
2:03
particular website or referring to a particular link at that time I will be using a
2:08
text box all right so we will start off with the text box I will click on text
2:13
box and the moment I click on text box you can see a text pane out here in which
2:17
I can type right so let's say that this report is giving us the projection
2:28
of revenue across different regions all right so the moment I type my text out
2:42
here I can resize it right I can also increase the font of it as you can see
2:47
it is very much small as of now so I will highlight this section and go under
2:53
this font tap and font drop-down menu and I can select any font which I want
2:58
and which gives an indication All right So automatically it is telling you that it talking about the projection It is this report is giving us the projection of the revenue across different regions all right
3:12
so let's resize it so that I do not see this drop-down menu or the
3:17
scrolling bar all right so this is how it is done now we can also add some
3:21
links along with it if I just hit enter and let's say that I want to introduce a
3:26
link so I will simply click here some type the name of the link let's say
3:30
www.torials point.com all right and if I want to refer to this particular
3:39
website I will highlight this text and give it a link the moment I click on it
3:46
automatically it takes HTTP that is this tutorial is point.com and it's done the moment
3:52
I hit done you can see the link is being active and this link can be seen out
3:57
here as well right so in order to Let me adjust this a bit. Okay, so in order to give some links in order to give some handy notes and in order to give some
4:09
Explanatory notes for the projection we generally tend to use the image box. I'm sorry the text box now moving on with the second one is the image now
4:19
What does this image do it? Nothing but add an image to our report now
4:24
Sometimes there might be a need that you want to add the logo of your company in this projection so that your
4:30
Projection becomes much more authentic and it becomes much more distinct. Alright guys so in order to do that I will simply click on this image dialog box which will apparently take us to the tab from where I can select under the desktop I have select a logo that is the tutorial point logo I will simply hit on open now what has done it has
4:50
simply added the image of the tutorial's point give me a moment all right now as
4:56
you can see that logo of the tutorials point can be seen out here as well so this is
5:00
how simple it can be let's say if I add this logo out here somewhere
5:05
Okay and resize a bit Okay, so basically it is showing me that
5:11
Image can be added to our projection in such a way that it makes my projection a little bit more authentic
5:18
Alright, so this was about image how to insert images and last but not the least is to add shapes now
5:24
There are very few shapes in compared to the Microsoft What do you say Microsoft products like Excel Word and PowerPoint? There are very nice
5:35
less number of shapes but these are the shapes which are more than enough at the time of
5:39
projection let's take an arrow which will help me to indicate like if I want to
5:44
point out certain thing that what should be what should we should we look out for
5:48
right so I will take this arrow and make it as a marker in such a way that my
5:53
attention goes on to the direction where it pointing towards all right guys so
5:59
this is how you can use the shapes the images the text box to make your
6:03
presentation or do you make your projection a little bit much more authentic and
6:08
much more distinctive all right guys so this was all about this video see you
6:13
until next time
#Business & Productivity Software
#Jobs & Education