live_tv
Livestream Starting Soon
00
Hours
:
00
Minutes
:
00
Seconds
Up next in 10

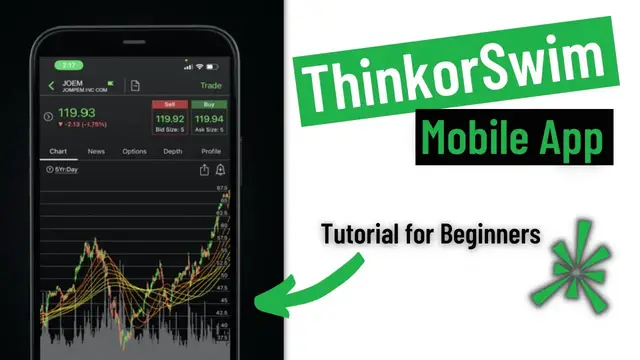
ThinkorSwim Mobile App Tutorial for Beginners 2023 |Step-by-Step Guide to Trade on TOS Mobile
Dec 17, 2022

ThinkorSwim Mobile Demo for Beginners 2023
In todays video we do a full demo of the ThinkorSwim mobile app. We cover everything you’ll need to know to get started trading on the app. Everything from how to place a trade, customize charts and view balances. The ThinkorSwim mobile app is just one of the apps offered by TD Ameritrade. However, it is the recommended trading app for those of you active traders out there.
Although I still prefer to do most of my trading from the Desktop application of ThinkorSwim, the TOS app is an excellent alternative. For those of you switching from Robinhood, this app will take some time getting used to, but it’s well worth the time to learn. You’re going to be able to easily access Level II data, view studies and indicators on your charts and trade complex products far more easily.
If you’re an options trader this is also the app for you. When viewing the option chain you can add any metric you find important when picking your strikes. Whether that be any of the greeks (delta, gamma, theta, vega), volume, probability OTM, or many more. It will also allow you to place more complex options spreads like Iron Condors or butterfly spreads far more quickly. It is also the only app through TD Ameritrade that will allow you to trade products like futures or forex.
Show More Show Less View Video Transcript
0:00
In today's video, we'll be doing a full tutorial on the Thinkorsome mobile app
0:03
We'll cover everything important like how to place a trade on stock and options, customized charts, view balances, and much, much more
0:09
I'll also be posting timestamps down below in the description, so if there's something specific you're looking for, feel free to skip ahead
0:15
After logging in, this should be the very first page you see, which is the watchlist page
0:20
Now, the watchlist page is where you're going to spend most of your time. This is where you're going to place orders, look at a chart, look at the option chain, and so on
0:26
but the other tabs we're going to dig into today will be the positions page down here at the bottom
0:31
the orders page, and then if you click on the more button, we're also going to dive into the
0:34
balances page and look at some of the settings you can adjust. Now starting with the watchlist
0:38
page, let's go ahead and click on it to go back there. From here, you can see the current watchlist
0:42
that we're looking at. Now if you look in the upper left-hand corner, this watchlist is called options. If I wanted to change the watchlist that I was looking at, I would simply click on the name
0:50
From there at the top, you can see we're looking at all of my personal watchlists. You can see all
0:53
of my dynamic watch lists, which have the little target next to it. You can also see all of my
0:57
manually made watch lists. And if we wanted to switch to one, we'd simply click on it like
1:01
indices and you see all of the companies in there switch to my new watch list. Now clicking back on
1:06
the name up in the upper left-hand corner, you can also go back and you can see all of the watch
1:10
lists made by TD Ameritrade like top 10. You can also go to public to see all of these, or you can
1:15
go to buy industry and you could just look at materials companies if you wanted to. Now we'll
1:19
go back to my pre-made watch list for just a second. Now from this watch list you can also
1:24
customize the headers up here at the top. Right now you're going to see things like symbol so
1:28
telling you the actual stock you're looking at, the last traded price, net change, open, bid ask
1:33
and you can also scroll that over to the left and you can see some of the other columns up at the
1:37
top. Now right now this might seem a bit busy there's a lot of columns up there at the top so
1:40
what we're going to do is clean it up a little bit by clicking on the gear icon in the upper left hand corner. From there you can see a list of all my visible columns and if you scroll down you can
1:48
search for columns you want to add. So for example, if we wanted to add dividend yield
1:52
we click in search in all columns. We're going to type in the word dividend, and we're going to add
1:56
dividend amount by clicking on the little plus icon and hitting done. Now up here at the top
2:00
we can see it's been added to our visible columns list. Now, if we wanted to delete something
2:04
like let's say we want to delete bid and ask, we'll go ahead and click on it and then hit delete
2:08
and we'll hit done. Now up here at the top, you can see that bid ask have been deleted. And over
2:13
on the right-hand side, we have added dividend amount. Now from this page, you've also probably
2:17
notice these little icons like to the right of SPY, you see a little purple circle with 24 in it
2:21
Same thing with IWM, a little purple circle, number 24. Those are little identifiers telling
2:26
you upcoming events that are happening. So in the case of this little purple circle, that's telling you that this stock trades 24 hours a day, five days a week. Other icons you
2:34
might see are going to be like little green circles with a dollar sign, which tell you an upcoming dividend, blue or red circles, which tell you upcoming earnings announcements. And
2:41
there's a few more, but you'll know when you see it. Now, if you want to look at a chart for a
2:45
company or place a trade on it. All we have to do is click on the company you want to trade or up
2:50
here in the top right hand corner, this little magnifying glass. If you click on that, you can
2:53
then type in the symbol of the stock we want to trade. In our case, we'll go ahead and type in
2:57
target or click on it since it's a recently viewed stock. From here, it immediately takes us to the
3:01
stock profile page. Up in the top left hand corner, we can see what the stock last traded for
3:06
In Target's case, you can see it traded for 237.31 and it was up 10 cents today. Now, if you look at
3:11
the current time 514. I'm in central time. The market has been closed for about two hours now
3:16
If we look at the bid and ask, you can see that it's changed slightly in the after hours. It's
3:20
237.01 by 237.58. And that is what it's currently trading for in the after hours. Now let's start
3:26
with first buying and selling the stock. If we wanted to buy the stock, we'd simply click on the
3:30
buy button. From there, it's going to take us to the order ticket. On this page, you're going to
3:33
tell the system what type of order do you want to use? How many shares do you want to buy? What
3:38
price do you want to pay for it and when and how long do you want the order good for? So starting
3:42
from the top, you can see up here it defaults to a limit order. All we have to do is click on the
3:46
little arrows if we want to change the order type from a trailing stop to a stop limit, market on
3:51
close, limit on close, market order, and so on. If we wanted to change the quantity of shares that
3:55
we're trading, we'll just click on the number right there and we'll type in, let's say we wanted to buy 200 shares. We'll hit done. Now the next box down, you're going to see it says cost of
4:03
trade. It's telling us that, hey, if you wanted to buy 200 shares of target at this price, it's
4:07
going to cost about $47,462. If we wanted to change how long and when we want the order good
4:13
for, you're going to see the time and force box, which defaults today. All we'd have to do is click
4:17
on the little arrows to the right to change it to good till canceled or EXT if we wanted to make it
4:21
for the pre or post market. Or you've also got good until canceled, including the extended session
4:26
And again, all we have to do is click on the little arrows to the left or right to change that. From there, if you actually wanted to continue with this trade, we would just hit review in
4:32
the upper right hand corner. It's going to take you to a little order confirmation box, again
4:36
telling you, are you sure? Do you really want to buy 200 shares of Target? It's going to cost 47
4:40
grand. If from here we actually wanted to place the trade, we would hit send. Since we don't
4:44
actually want to place it, we'll hit edit. We'll cancel out of this and it takes us back to Target's
4:48
stock profile page. Same thing if we wanted to sell or short the stock, we just hit that big red
4:52
sell button. And from there it takes us to an identical page. Just now it's red instead of green
4:57
signifying that we selling the shares instead of buying them Now going back we going to start with the chart page up here in the top left We simply have to click on that little chart tab and it brings us to a chart for target Now in the top left hand corner you going to see the
5:08
current timeframe. Right now we're using a 20 day, one hour chart. So right now this chart is looking
5:13
back 20 days. Each candlestick represents one hour of trading. If we wanted to zoom in on the chart
5:18
we just put our two fingers on the chart and spread our fingers apart. And that's how we zoom
5:21
in. If we wanted to zoom out, we just do the exact opposite, put our fingers together and it zooms
5:25
out. Now, if we wanted to change the timeframe entirely, we just click on the letter T in the
5:29
upper left-hand corner of the chart. It's then going to give us a list of our favorite timeframes
5:33
If we wanted to use something other than what's in this list right here, we could just click on timeframe and make our own. Let's say we wanted to go to a 10-year chart. It's going to take us
5:42
some time, but we can go to 10 years there. And each candlestick right now represents a day. We'll
5:47
change that to one month. And now we're looking at a 10-year chart for Target. Each candlestick
5:52
represents a month. Now, right now, looking at my chart, you can see the chart up at the top
5:56
but you can also see this indicator down here at the bottom and it tells you it's the RSI
6:00
To add indicators or add studies, all you have to do is click on the chart itself. From there
6:04
it's going to bring up a chart menu on the left-hand side. All of the studies or indicators
6:08
are going to be on that little beak icon second from the top. From there, you can see a list of
6:12
categories down below. You can click on those. You can see all the studies that are in that category
6:16
or if you know the name of the study you're looking for, just click in the study search box
6:21
type in the name of the study. Like if we're looking for simple moving average, we'll go ahead and type in the word simple
6:25
We see it there second from the top. We'll click on that little plus icon and we see it added to our list of studies
6:30
up here at the top. Now, right now, simple moving average defaults to a nine day simple moving average
6:35
What we're gonna do is edit that by clicking on the little gear icon on the right hand side. We're gonna change that from a nine to
6:40
in this case, a 200. So go ahead and type that in, hit done. We're also gonna change the color of the line
6:45
by clicking on that first box up here that's got the color green. We're gonna then click on the color box
6:50
and we're going to change it to, we'll do this like the yellowish color. Now we'll go back to study
6:56
We'll hit back one more time and then we'll hit the done button in the upper right-hand corner. And now we can see the 200 period SMA
7:02
up here at the top of the chart. That's that yellow line that we see there. Now, if we want to delete a study
7:06
we just click on the chart again, go back to the studies icon, click on the little minus button
7:11
delete, hit done. And now it's been removed from our chart. From here, you can also draw trend lines
7:15
or price lines, support resistance, et cetera. All we have to do is again, click on the chart
7:19
click on the little drawing tool at the bottom. We're going to say new. We're going to say we want
7:24
to draw a trend line. And just like on the desktop platform, all you have to do is point and click
7:28
So if we want to draw a trend line, we click here and we'll click here to draw the trend line. And
7:32
there we go. We got a trend line right now on our chart. To remove the drawing, we again, just click
7:36
on the chart itself, click on the little pencil icon, remove drawings, click on the drawing we want
7:41
to remove and hit remove. Now, looking back up at the top, if you see the tabs up here, you can see
7:46
chart, news, options, level two, and profile. We're going to the news tab next. This is where
7:51
we can see all of the recent news articles that have come out about Target. First, you're going
7:55
to see the headline of the article itself, then the time that it came out. To read it, just click
7:59
on it and boom, you got the article right there in front of you. In our case, we're going to go back
8:02
News tab, not a whole lot to it. Just shows relevant news. Going to the option chain next
8:06
this is where we're going to trade options on this page. Now at the top of the page, you're going to see things like implied volatility, IV percentile, which is actually
8:13
ivy rank on this platform you're going to see the volume weighted average price and the historical
8:18
volatility percentile so right there at the top you've got some useful info you've also got columns
8:22
here like spread custom strikes all exchange best what i tell you is always leave exchange on best
8:28
change spread to custom because yours is going to default to single so i would automatically change
8:33
it to custom and for me i like to see all available strikes but if you click on that column right there
8:38
you can then change the number of strikes that you're seeing maybe we don't want to see so many
8:41
we could limit it to only 10 being visible. And now we've only got 10 strikes once we open up an expiration
8:47
Now looking down below in the option chain itself, you can see just like on the platform
8:50
it lists off the date of expiration, parentheses next to it is the number of days
8:54
until expiration. And then on the far right hand side is the implied volatility. So for example, we could see the 16 July 21 expiration
9:01
is 23 days out, and it's got a current implied volatility of 20.58%
9:06
If we chose that expiration to trade, we'd simply click on it to open up the available options down the middle
9:11
Now, down the middle, we can see all of the available strikes, 225, 227.5, 230, and so on
9:17
We can then see the current bid and ask on the left-hand side for the calls, current bid and ask on the right-hand side for the puts
9:23
Now, all of the in-the-money options have the blue-shaded background. All of the out-of-the-money options have the black background
9:28
Now, to buy options in here, it's just like on the regular desktop, so if you're used to that, this should be an easy crossover
9:34
All we have to do when we're buying is click on the asking price. When we're selling, we click on the bid price
9:39
So for example, if we wanted to buy the 240 calls, we'd find the 240 strike right here in the middle
9:43
We'd then look over on the left-hand side. We'd see the current bid ask is $2.89 by $3
9:48
And when we're buying, again, we click on the asking price, which in this case is $3. We just go ahead and click on that
9:53
And we're going to see that it gets added to the top of our screen. Right up there, you could see that we're buying one of the 16 July 240 calls
10:00
Now if that all we wanted to do is just buy a 240 call we go ahead and hit next From there it going to take us to the order ticket where again we just going to say what type of order we want to use how many contracts we want to buy what price we want
10:10
to pay. And then it gives us the approximate cost of the trade. Now, if we wanted to create a more complex trade, let's go ahead and delete this out
10:16
of here. Let's say we wanted to create a spread. We wanted to buy a 240 by 245 call spread on target
10:22
Well, just like before, we're going to click on the ask of the 240, so $3. And we're going to click on the bid of the 245, $1.37
10:29
You can see that both of those legs get added to the top of the page. We're buying one of the 240s, selling one of the 245s
10:35
When we hit next, it's going to show us that it's creating a vertical call spread
10:40
And you can see that we're doing it for a net debit right now of $1.53. Now to create other spreads, you would do the exact same thing
10:46
Let's say we wanted to create an iron condor. Let's go ahead and delete these out of here real quick
10:52
We're going to do the 230 by 225 by 240 by 245
10:58
and you can see that again after we hit next it auto creates an iron condor all for a net credit
11:04
of $2.26. The reason we changed that up here at the top from spread single to spread custom
11:09
was to allow us to create these spreads very easily. Otherwise if you had this set to spread
11:14
single anytime we clicked on a leg like let's say we clicked on the ask of the $2.40 $3 it
11:19
automatically takes us to the order ticket rather than allowing us to create a spread. So again the
11:24
first thing I would do is come up here to the top, change this from spread single to spread custom
11:29
Just make it easier on yourself. Now on the option chain, you can customize this a bit. You're going
11:33
to see that my current columns are bid ask and theta. Now, if you want to add columns or take
11:38
columns away, all we have to do is click on the little gear icon up here at the top. From there
11:41
you can see a list of all my visible columns. And if we scroll down, we can see all of the
11:45
available columns to us. Just like before, if we wanted to add some things like delta
11:49
gamma we just hit on the little plus signs if we hit done now right now you can't see those other
11:55
columns we added but if we scroll over on the page we can see our new columns are delta and gamma so
12:00
you can really fill up this page with whatever information you find important but you're only
12:04
going to be able to see three columns so really kind of limited on how much you're going to see
12:08
at any given time now that's all we'll talk about for the option chain for right now we'll go back
12:12
up to the top if we click on the level two tab you're going to see the depth of the market on
12:16
this particular stock. So you're going to see all of the shares that are available. If we click on
12:20
the profile page, you're going to see the current revenue streams for this company. You're going to
12:24
see a breakdown of how much money they actually make, how they make their money, what their expected
12:28
growth is, and their profit margins. So this can be a pretty helpful page. It's not available for
12:33
all stocks, but it will be available for all the big ones. Now, just as a little recap, the way that
12:37
we access all this information was by going to the watchlist page and then either clicking on a
12:42
stock we wanted to trade like Google or by typing in the symbol up here in the top right hand corner
12:47
where that little search box was at. So in our case, we'll go to Google, G-O-O-G, hit done
12:51
And now we're on the stock profile page. Now, as somebody who's been using this app for a very
12:56
very long time, this is probably where you're going to spend the vast majority of your time
13:00
because this is where you can access all of the information is from the watchlist page. This is also where you're going to be placing your trades. So I would get very comfortable
13:07
with this page right off the bat because this is where all of your information lies. Now, one more little helpful hint
13:12
If you see the current stock price up there in the top left-hand corner, 25, 29, 23
13:16
If you click on the little arrow to the left of that, it's going to open up even more stock info
13:20
Things like market caps. So it'll tell you Google in this case, it's a $1.6 trillion company
13:25
It traded 984,000 shares today. You can see things like it's open, high, and low for the day
13:31
You scroll to the left, you can see even more info. And if you scroll to the left one more time, you got a little customize button
13:37
Just like everything else on here, you simply click on the little minus button. if you want to delete something, scroll down if you want to add something, and these little lines
13:44
on the right-hand side let you move it up or down. Now that's going to be it for the watchlist page
13:49
The next tab we're going to talk about is the positions page. So go ahead and click on the
13:53
second tab down at the bottom, positions. From there, you're going to see a list of all of our
13:57
current positions. You're going to see that I've currently got 100 shares of American Airlines
14:01
and you can see that there's nothing in the Apple column, the AMD column, but then you see 12 shares
14:05
of Amazon. Now when you don't see any shares listed for something like Apple, but instead see a little
14:09
arrow to the left, that means I currently hold options on Apple. Now to see those options, all we
14:14
have to do is click on the little arrow to the left of the symbol, and then it's going to give us a dropdown of all the options we currently have. Now, right now you can see all I have is a short
14:22
120 put against Apple for the 16th of July. And if you move your eyes to the right, you can see I
14:27
sold it for 91 cents. It's currently 26 and a half cents. I'm up 64 bucks on it right now. And if I
14:33
scroll to the left, you can see I made 250 on it today, and I'm up 70% overall in this position
14:39
Now, if we wanted to close out that option or if we wanted to close out stock, all we
14:43
have to do is click on the little box to the left of the symbol. From there, we're going to say close selected in this case
14:49
And from there, it takes us to the order ticket where, again, we're going to say what type of order we want to use, how many contracts we wanted to buy back and what price we wanted
14:55
to buy it back for. Now, you can do the exact same thing for stock. We just click on the little checkmark box next to the stock we want to sell, in this
15:02
case Amazon We going to say close selected From there it going to give us the type of orders we can use For right now we always going to use the very top one Sell 12 shares of Amazon We going to say close selected From there it going to give us the type of orders we can use For right now we always going to use the very top one sell 12 shares of Amazon We going to say close selected And again it takes it to the order ticket Now going back to
15:15
the page for a second, just like everything else on here, you're going to see a little gear icon
15:18
up in the top left-hand corner next to the word symbol. From there, you can adjust all of the
15:23
columns of information you want to see. And if you want to move them around, you just click on the
15:27
little lines to the right-hand side, you can drag it up or down. Now, if we scroll to the bottom of
15:31
this page, if you have a lot of symbols, that might take a second. You can see what my P&L for
15:35
the day was. I was up a thousand bucks today. You could see that P&L opened up $24,000 in total on
15:41
all these positions I'm holding. You can see the current value of your portfolio and you can see
15:45
how much money you still have left to spend in the account. Now there's really not a whole lot to this page. All it does is give you a breakdown of what positions you currently have. Are you up
15:53
Are you down? And from here, you can close your open positions, but that's really all there is to
15:57
it. Now, once you place a trade, you're automatically going to be taken to the order status page
16:01
which is down here. It's the fourth tab at the bottom. Go ahead and click on orders. From there
16:05
you can see all of your current working orders, or you could go back in time by clicking on all
16:09
You can see all of the trades we placed today, or we could go back with the filter and see all
16:14
the trades we placed in the last 30 days. Now from the working orders tab, go back there
16:18
first tab at the top. If we had a working order, this is where we could either cancel the order
16:22
outright or cancel and replace it, which is just synonymous for edit the order. Now, since I don't
16:27
have any working orders right now let's go ahead and place one just so we can see what it looks like
16:35
now that i placed the trade you can see it's right here as a working order let's say i wanted to
16:39
cancel that order all i'd have to do is click on it then hit cancel order hit yes and now that order
16:45
has been canceled so again not a whole lot to this page but you will come here if you ever need to
16:50
cancel your orders or edit them slightly but that's really all this page is for now the next
16:54
next thing we're going to go to is the more button bottom right hand corner you're then going to go
16:58
to the balances page now when you come here for the very first time your page is not going to look
17:03
as clean as this that's because i've deleted a lot of the available items that you can have listed
17:07
here and i would do the same if i was you now to do that all you have to do is click on the little
17:11
gear icon up here in the top right hand corner then what you're going to do is start deleting all of the columns that are not important to you the things that are important to me are things like
17:19
net liquidating value the total value of my account cash and sweep so i can see how much cash i
17:23
actually have left in the account to spend of my own money. Options buying power so I can see how
17:27
much money I have to spend on non-marginal securities like options and penny stocks
17:31
Stock buying power so I can see how much money I have available to spend on fully marginal stock
17:35
like Apple or Netflix. Day trading buying power so I can see how much I have available to spend
17:40
intraday, not that I really ever use it. And then total commissions and fees year to date so I can
17:44
see how much I've actually paid TD Ameritrade so far. Now from that page like I told you before
17:48
this is where you're going to see all of your available balances so it's going to be a really important page for you to come to especially if you have a margin account now from the more button
17:56
you can also adjust some of your settings so we're going to click on more go to settings in the lower
18:00
left hand corner now the big things that I could see you guys changing is like the look and feel
18:04
some people don't like this dark background so if you come here you look for look and feel you look
18:08
for the theme you could change that from dark to light and it'll change it to a white background
18:12
instead from here you can also invert the colors for some reason if you wanted it to be red instead
18:18
of green when the sock is going up or green if it's going down you could hit invert right here
18:22
and this is where you could change that and you can also change your security settings this can
18:26
be a little bit frustrating so for me i change it to face id so anytime i place a trade it's going
18:30
to have me authenticate my face to make sure it's really me placing the trade and it's going to auto
18:34
lock me out of the platform after five minutes of not using it so again this is where all your
18:38
settings can be accessed from the more page you can also access a calendar of all the upcoming
18:43
events. So right now we're on June. If we wanted to look at June 24th tomorrow, we could see all of
18:48
the events coming out tomorrow. Or if we scroll down, the green are all the companies that go
18:52
ex-div tomorrow. So we would have need to bought these companies today to be entitled to all these
18:57
dividends. From the more button, you can also switch to your paper money account if you wanted
19:01
to access paper money. Now we're trading in a paper money account. So all of this is practice
19:06
none of your real money. And to go back, we just go to more, switch account, go back to live trading
19:11
Now, what we covered today were all of the big tools on here. Obviously, it's going to take some practice to get the hang of it
19:16
But with the app, it's really what you see is what you get. Most of the tools, most of the functionality that a lot of people like is going to be on
19:23
the actual desktop platforms, things like the scan tab, things like the risk profile page
19:28
You really need to go there if you want to access some of those advanced tools. But when you're on the go, this is obviously an amazing app to use
19:34
I definitely use it when I'm trading options and I'm away from my computer at home. Now, if you guys did miss anything, feel free to use those timestamps down below to go to
19:41
a specific topic, and if there's anything I missed, please drop your questions down below
19:46
But we'll go ahead and end the video there, and I hope to catch you guys all on the next one
#Finance
#Investing
#Stocks & Bonds
#Mobile Apps & Add-Ons