live_tv
Livestream Starting Soon
00
Hours
:
00
Minutes
:
00
Seconds
Up next in 10

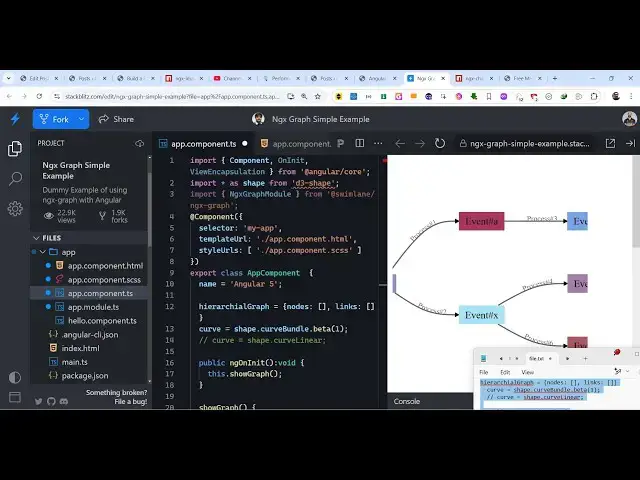
Angular ngx-graph Example to Build Flowcharts & Diagrams Using ngx-chart Library in TypeScript
Feb 5, 2025
Get the full source code of application here:
https://codingshiksha.com/angular/angular-ngx-graph-example-to-build-flowcharts-diagrams-using-ngx-chart-library-in-typescript/
Hi Join the official discord server to resolve doubts here:
https://discord.gg/cRnjhk6nzW
Visit my Online Free Media Tool Website
https://freemediatools.com/
Buy Premium Scripts and Apps Here:
https://procodestore.com/
Show More Show Less View Video Transcript
0:00
uh Hello friends welcome to this video
0:02
so in this video I will show you a
0:03
angular example to show these nice
0:06
little flowcharts and diagrams using uh
0:10
a module here we are using two sets of
0:12
modules angular charts and angular uh
0:16
flowcharts package you can see that we
0:19
can create these nice little flowcharts
0:21
we have this node here we have the
0:23
second node you can create connections
0:25
right here you can create these arrows
0:27
so this is really helpful if you want to
0:30
explain anything inside your application
0:32
so these modules will make it very much
0:33
easy you can even see I'm also able to
0:36
move this inside this using my mouse as
0:38
well so I can use my mouse and you use
0:42
this flowchart or anything that you can
0:45
say it's a chart flowchart diagram that
0:48
is there the user can move it with their
0:50
Mouse and also zoom in as well using the
0:53
scroll here so there is a package here
0:56
which allows you to build this so the
0:58
package name so we are using two
1:00
packages at the same time if you go to
1:02
npmjs.com there is the first package ngx
1:07
graph this is the first package which
1:09
allows you to build these nice little
1:12
graphs it specifically we are build we
1:15
are using this package at theate swim
1:18
Lane SL ngx graph this is built by this
1:23
person so we are using this specific
1:25
package
1:27
so if you just search it
1:30
this will be the thing graph
1:32
visualization if you want to build these
1:35
nice little graphs so this is actually
1:38
the command this is the first package uh
1:41
it's almost having 14,000 weekly
1:43
downloads and the second one is ngx
1:49
charts so this is actually the package
1:51
for drawing out charts here so you need
1:56
to first of all go to your app. module.
1:59
TS file this is your file here I have
2:02
also written a step by-step blog post on
2:04
my website holding the full example code
2:06
so if you need the full example code you
2:08
can follow the blog post the link is
2:10
given in the description so first of all
2:12
you need to add these two import
2:14
statements right here so what we are
2:16
doing right here we are importing both
2:18
these modules ngx graph module and the
2:21
ngx charts module which will be coming
2:24
from these respective packages so you
2:26
add this import statement then you go to
2:28
the Imports array and just write these
2:31
two NGS graph module and NGS charts
2:34
module so that's all the configuration
2:36
code is required so now you can close
2:38
this file and you need to come to your
2:40
app. component.ts file so this is your
2:45
and
2:46
here you also need to delete everything
2:49
and start from scratch so just refresh
3:02
so here we
3:03
basically just declare
3:07
a array here where we
3:10
put Let Me declare a NG onit
3:15
function so here we
3:17
actually need
3:19
to declare this function which is show
3:22
graph so it will actually be responsible
3:25
for showing
3:28
the so just let me just paste it
3:35
this so here what happens right here you
3:39
can actually modify
3:42
this this is your start here this is the
3:46
label that we give right here which is
3:48
scan you can change this label to
3:51
anything so this is your label that you
3:54
see right here this is your label of the
3:56
graph this is your position right here
3:59
this is starting and this is you can put
4:03
ID label position so these three
4:05
attributes it takes so each object
4:07
represents a node right here in the
4:09
graph so then you put this process one
4:12
process two right here if you
4:15
see so here you can customize everything
4:18
right here using these properties that
4:20
you see right here to actually build
4:22
this nice little flowchart and diagram
4:25
and uh you can read more about it in the
4:27
docs as well if you see these three
4:30
properties you just need to customize it
4:32
I have also given this full example code
4:34
in the description of this video at my
4:36
blog post and you just need to customize
4:38
it if you want to change it accordingly
4:40
to your choice so in this way you can
4:43
use this module to actually build this
4:45
nice flow charts and diagrams using this
4:48
angular package so thank you very much
4:51
guys for watching this video and also
4:53
check out my website as well free mediat
4:56
tools.com uh which contains thousands of
4:59
ruls regarding audio video and image and
5:02
I will be seeing you guys in the next
5:03
video
#Programming
#Software
#Education