Up next in 10

Python 3 Bokeh Library Script to Plot CSV Data as Interactive & Colorful HTML Web Charts in Browser
Jun 1, 2025
Get the full source code of application here:
https://codingshiksha.com/python/python-3-bokeh-library-script-to-plot-csv-data-as-interactive-colorful-html-charts-in-browser/
Show More Show Less View Video Transcript
0:00
uh hello guys welcome to this video so
0:02
in this video I will show you uh yet
0:05
another Python data visualization
0:07
library for plotting charts from raw
0:11
data so in this example we are taking a
0:14
simple example of data which is there
0:16
inside the CSV file we have two columns
0:19
name and
0:20
age so we have written this Python
0:23
script so once I execute this it will
0:25
generate this HTML web
0:27
charts using this data so as I execute
0:31
this you will see on the left hand side
0:33
it will create a folder which will
0:35
contain the HTML file right here so this
0:39
is your HTML charts web charts which are
0:41
generated if you directly open this file
0:43
in the
0:47
browser so your charts will look
0:50
something like this this is your basic
0:52
bar chart so you can see then we have
0:55
the line chart the scatter chart all
0:57
these charts are
0:59
supported and the package which we are
1:02
talking about this is bokeh b O K E
1:06
H so this is actually a very famous
1:09
library which
1:12
interactively charts are generated
1:14
directly in the browser from Python so
1:16
this is actually the package simply
1:18
install this by executing this
1:22
command so it's an open-source package
1:26
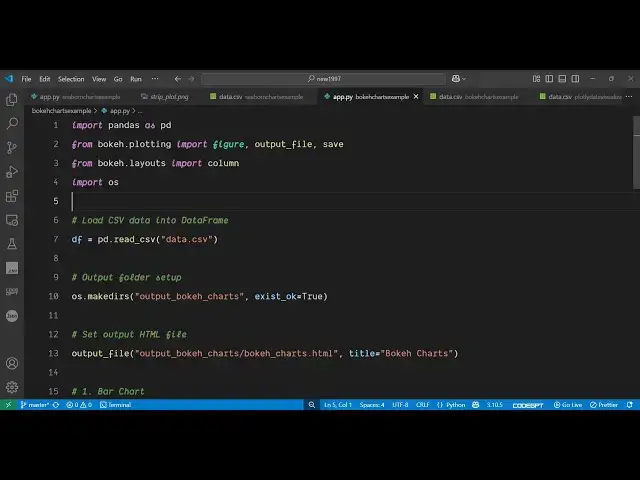
so after that uh just create a simple
1:29
app py file i have given all the source
1:32
code in the description of the
1:35
video so now to get started here you
1:38
simply first of all require the pandas
1:40
package as
1:41
well import this as well install this
1:45
and then from this package which is
1:49
booco.plotting we need to
1:51
import the figure the output file these
1:55
are various methods which are there
1:56
inside this
1:59
package and then it also contains this
2:01
layouts property as well from this we
2:04
need to import column and the operating
2:06
system modules after importing all these
2:09
packages now we need to read the C CSV
2:11
file for reading it we use the pandas
2:14
library which contains this function
2:16
read
2:18
CSV and we actually pass the actual
2:21
file and then we make the actual
2:25
directory the output
2:29
directory so after making this we will
2:32
create this HTML charts file
2:37
so you'll simply use this function of
2:40
output file which we are importing it
2:43
right here this will create a web chart
2:46
for us inside your directory output
2:55
slash and you pass the extension right
2:58
here which the title you can even
3:01
customize the title as well
3:06
so after doing this we will
3:09
be exporting each chart here first of
3:12
all your bar chart which looks something
3:15
like this you provide the values here
3:17
which is your name the height of the
3:20
chart everything the name and
3:23
age similarly we provide the line chart
3:26
and the scatter chart as well
3:33
so then after that we print out that all
3:35
your charts have been generated
3:40
so so if you go to the terminal simply
3:44
run this you will see it will generate
3:46
this output
3:53
file
3:55
so so nice thing is that you can even
3:57
customize the look and appearance of it
3:59
so here we are providing the color to be
4:02
sky blue i can even change this to any
4:05
other color which is blue this I can
4:08
change to red and this one to yellow you
4:11
can customize the look and appearance as
4:13
well you can also customize the size as
4:16
well the height each and every property
4:21
so also check out my website which is
4:24
freemediatools.com
4:26
uh which contains thousands of tools
#Programming
#Scripting Languages