Up next in 10

Power BI - Pinning a live page
Watch more Videos at https://www.tutorialspoint.com/videotutorials/index.htm
Lecture By: Mr. Akshay Magre, Tutorials Point India Private Limited
Show More Show Less View Video Transcript
0:00
Hello, friends and welcome to Tuttle's Point
0:03
In this segment of the video, I'm going to show you what is pinning a live page in Power BI service
0:09
Now, pinning a visual of a report to a dashboard will simply create a smart snapshot to the dashboard
0:18
But whenever I pin a live page to the dashboard, it will make the report live and interactive
0:24
so that we can play along with it and see the results and it becomes dependent
0:29
dependent on each other. So let's go ahead and see what is pinning of a live page in dashboard
0:35
in our practical approach. Hello friends and welcome. In this part of the video, I'm going to
0:41
show you how to pin a live page in Power BI services. All right. So let's get started off
0:47
Now before I get started off, let me tell you the reason behind why we pin a live page. Now sometimes
0:52
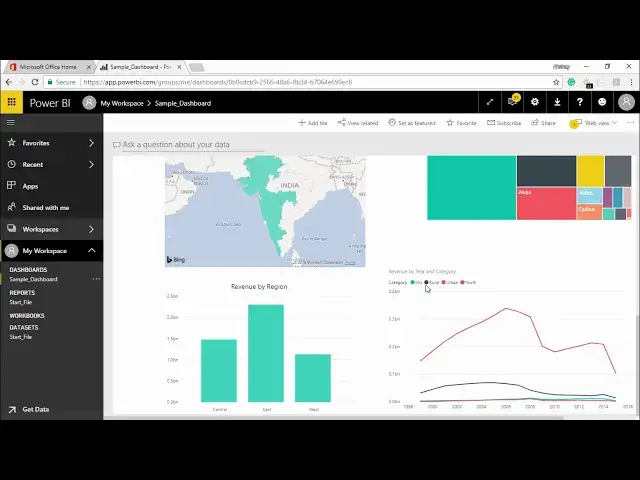
what happened whenever I go to a sample dashboard, it is showing me the projection that we have
0:57
pinned. But the problem with this. dashboards is that it's a static dashboard or it's a smart screenshot. What do I mean by that
1:06
I can able to see the values out here every time and I hover the mouse. But whenever the data set
1:11
changes, that means if there is addition to the data set, this particular report does not get refreshed
1:17
Also, the purpose of making the live, the dashboard pinned to the live page. The reason being
1:23
whenever I worked on Power BI desktop services, at that time we have already seen that all
1:29
all the reports are interconnected. What do you mean by that? Whenever I select a part of the projection and if I click on a part of the projection the rest of the projection also behave related to the category that I have selected so it is interconnected in such a way that if I select for an example if I select van dersel so all the projection should be
1:49
concerned with the van darsall itself so this is what the purpose of that live
1:54
page is all about all right guys so this is why I pin a live page in Power BI service
2:00
so how I do that it's quite simple I have to simply go under the start file and
2:04
under the start file I have an option call as pin as a live page I will simply click on this option and the moment I
2:11
click on this option it is asking you yes you want to create this into existing
2:15
dashboard or whether you want to create a new dashboard for the same you can select either of this we can start with a new dashboard and let's say pin live
2:24
right so basically I'll get me an idea that this is a live dashboard that means
2:28
it is interconnected in such a way whenever the data changes my dashboard will
2:33
also change along with it so I'll simply click on pin line Now I have this dashboard which says spin live. I'll simply click on it now the moment I click on it see the all the
2:43
projection can be seen on this particular page. Let me close this thing off now if I click on any of the projection
2:48
You see the projection automatically changes so it is right now showing you the projection for Vanard
2:56
Ardissell right and it is showing the relative reference for it as well if I click on this you can see the projection changing if you click on this you can see the projection changing
3:05
So pinning the PINning the dashboard or pinning the projection on a live page
3:10
It helps me to create a report which are interconnected and dynamic as well guys
3:15
Okay, so this was the purpose of pinning the live page in power BI service
3:19
Hopefully you guys like this video see you until next time
#Business & Productivity Software