Up next in 10

Power BI - Categories with no data
Watch more Videos at https://www.tutorialspoint.com/videotutorials/index.htm
Lecture By: Mr. Akshay Magre, Tutorials Point India Private Limited
Show More Show Less View Video Transcript
0:00
Hello, friends and welcome to Tutorials Point
0:03
In this segment of the video, we are going to see how to view categories with no data
0:08
Now by default in Power BI desktop, what happens is whenever I have a column heading
0:14
it will only be shown in the report page if it has certain data into it
0:19
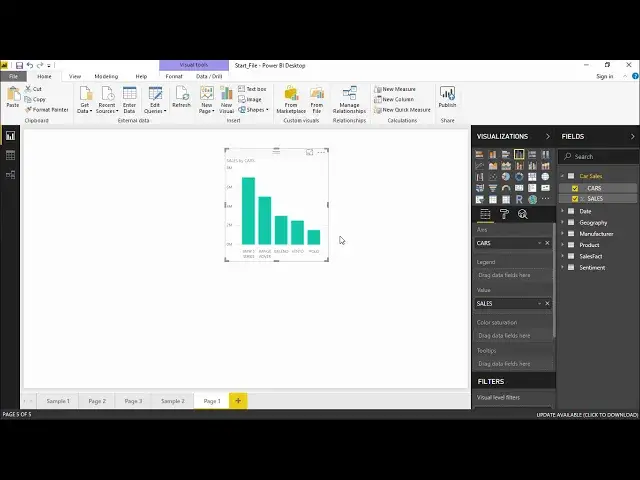
Now let's take for an example, I have a car sales table, right
0:23
In this table, I have few of the categories which has not generated any amount of sales
0:29
So whenever you try to create a report for the same in a table or in a matrix visualization
0:35
it will not display those category which has no data into it
0:39
Now in order to see that, what we have to do is we have to go under the visualization
0:44
pane and under the visualization pane you will find that particular field
0:48
If you click on that drop-down menu, you will find an option which says, show items with
0:54
no data. The moment you click on it, it will show you those items as well
0:59
which has no data in it. Now let's go ahead and see it practically how it is done
1:04
Hello friends and welcome back. In this part of the video I'm going to show you how to
1:10
view categories with no data into it. Alright so let's get started off. I will move on
1:15
to the field paints and out here I have created a new table with say car sales. If I open
1:21
this table I have two columns which have the car names into it and their relative
1:26
sales along with it. So I will quickly take it take these two columns and create a table chart so I will take here sales and I take this cars so I have name of all the cars and their respective sales along with it let get it in a tabular format so I have to select this table in which I can see the name of all the cars and their respective sales along with it and at the bottom
1:48
I can see the total as well let's quickly go ahead and increase the font size
1:52
so that everybody can see this particular report okay I will also go ahead and
1:58
increase the column header size from here and I'll increase it all right
2:04
So now you must be thinking that I must be having all the entries
2:09
But no, that is not the scenario. Power BI tend to take only those entries which has some record into it
2:16
If there is a blank entry, it tends to skip it. Now how will I figure that out
2:21
I simply have to go under this field pane and under this field pane, I will go under this
2:28
CAST drop-down menu. The moment I click on this drop-down menu out here, the very second last option which I see is
2:34
is show items with no data. That means there have been some certain cars which
2:39
there has been no sales. So if I want to see those as well I simply click on this
2:44
option. The moment I click on this option I see there are two more entries which do not
2:48
have any sales associated with it and that is the reason PowerBi was not showing
2:54
them on your table screen. So guys this is how simple it is if I want to view any
2:59
hidden data or any data with no data in any category with no data
3:04
into it you simply have to go under this field pins and select that column and click on the drop-down menu and select this particular option which says show item with no data all right guys so this was all for this video see you until next time
#Autos & Vehicles
#Business & Productivity Software
#Data Sheets & Electronics Reference