Up next in 10


Today we’ll go through a few of the methods available within thinkorswim to manage risk. Specifically focusing on the risk profile tool available within the platform.
The most basic use of this tool is to see how the positions you hold or even hypothetical trades will play out over time. So you could see how stock price, time decay, or even volatility changes will effect the positions you hold or are analyzing. It’s not going to tell you what trades to do, or give you recommendations or anything like that, but it is super useful.
The more advanced use of the tool is to manage portfolio risk and even beta weight it against an index. So that way we can manage everything all at once, and manage risk as needed. But check out the next video I make on managing portfolio risk to learn more on that, since I think we need to start with the basics first.
Show More Show Less View Video Transcript
0:00
Today we'll be going through a few of the different methods available within Think or Swim to manage our risk more effectively
0:06
There is definitely a lot to cover, so I'll probably be breaking this out into a couple separate videos to make sure you really get the hang of it
0:13
And as you'll find out here in a minute, it can be a little bit confusing. The tool we'll be discussing in today's video is specifically called the Risk Profile page
0:22
and that can be found within the yze tab. The absolute most basic use of this tool is to see how your positions you hold or even
0:29
hypothetical trades are going to play out over time. So here we could see how things like the stock
0:35
price changing or time decay or even volatility changes are going to affect the value of our
0:40
positions or even hypothetical trades. Now what it is not going to do is tell us what trades to do
0:46
or give us advice or recommendations or anything like that, but it is still super helpful for what
0:52
we're doing today. The more advanced use of this tool and probably what I'll end up saving for a later
0:57
video is how we can use it to manage overall portfolio risk and even beta-weighted against an index
1:03
So that way, instead of managing each individual position one at a time, we're going to manage everything
1:08
all at once, and then we have a more comprehensive view of our overall risk in the account
1:13
But if you did want to learn more about that, check out my next video after this one on managing
1:18
portfolio risk to learn more about that, since I think we first need to start with today's video
1:22
covering just the absolute basics. So how do we use this thing? How do we custom
1:27
and how do we actually make good use of it? Beginning with a very simple stock position, if we were to look at the very top of my page
1:35
you can see here I currently have PayPal up here. That means the only thing I'll be looking at is either PayPal positions I currently hold
1:42
or hypothetical trades that I'm building out on PayPal. Coming down to the very bottom of your screen, you'll actually see both my current positions
1:50
as well as the hypothetical trades here. Here at the top, you can see I currently have a real stock position, which is kind of hard
1:57
to see it's kind of got just a transparent kind of grayish background. But this is how all of your current positions will look, all of the positions you really hold in the
2:05
account. So in this case, in this paper money account, I currently have 100 shares of PayPal
2:10
Right below that, we can then see a hypothetical trade to buy additional shares of PayPal
2:15
And this one is going to be a lot more obvious. It is a bright green line
2:19
So your real positions are going to have the grayish background. Your hypothetical trades are either going to be highlighted in green or highlighted in red
2:26
This is how they're always going to look. So again, I've got a real position to buy 100 shares
2:31
and I've got a hypothetical trade to buy additional 50 shares of PayPal
2:35
Coming over here to the left, you'll actually notice that both of these are actually checkmarked
2:39
meaning we're actually yzing the risk of both of them all at the same time
2:43
If I were to come down here and uncheck one of them, for example, if we were to deselect the hypothetical trade to buy additional shares
2:51
we are now just managing the risk of our current position. Now in terms of what this screen is actually showing us and how we can use it
2:58
there's obviously a lot going on on the screen right now. So let's first begin by coming up here to the price slices
3:04
Here we can see there are actually three separate price slices for PayPal
3:08
Right here is the current price, so it's got a $0.00 offset. And it says right here PayPal is currently trading for $93.26
3:16
Right above that and below that, we can then see a 10% offset
3:20
So if PayPal were to go up 10%, it would go up to 10.59
3:24
And if it were to go down 10%, it would go down to 83
3:29
This could also be adjusted if we wanted to put in a very specific price
3:33
Like let's say we wanted to figure out how much we would be up or down if it went down to, let's say, $80
3:39
I'm just going to type in $80 here and then hit enter. Or if I wanted to adjust the offset I could come up here to this one and say what would it be if it went up 20 So I could just type in 20 here and again hit enter To the right of those numbers we can then see what information this is displaying
3:57
So here we can first see our Greeks, which since we're only holding stock in this example
4:01
we'll just skip for now and I'll talk about that later when we have an option position here
4:06
But then coming over here to the far right, we can then see how much we would be up or down on this position if it actually went to those levels
4:13
So right here it's selling me if PayPal were to actually go up 20. I'd be up about 3,700 bucks. Whereas if it went down to $80, I'd only be up about $500
4:24
So I must have bought these shares quite a while ago, and you can see down here that I did. I bought
4:29
them at $75 a share. Now, if we were to come back down and select that hypothetical trade again
4:35
if we were to look back up here at the top, we can see all of these values that have now changed
4:40
I would now be up $4,653. And if it went down to $80, I would be down
4:46
$168. So instead of being up 500 bucks, I would now be down 168 bucks. Besides the price
4:53
slices, if we look up here at the top, we can also see a profit and loss graph. And this is more of a
4:59
visual of what we just talked about with the price slices. Coming over here to the left-hand side
5:04
on the Y axis, we can actually see our profit and loss. And then down here on the X axis, this is
5:10
the actual stock price. So if I were to come up here and put my mouse actually on the graph itself
5:15
if I were to move my mouse left and right, this is actually telling us how much we would make or lose
5:20
if the stock price went to a specific level. If we had options positions in our account
5:25
we could also adjust things like time decay and volatility changes, and in order to do that
5:30
we would come down here to the calendar icon in the lower right-hand corner
5:34
So this is where we could come and actually adjust the calendar date right here, and then we could actually factor in a specific amount of time
5:41
a specific amount of time decay. We could also adjust the volatility levels by
5:45
coming down here to the gear icon, and then coming over here to the left and adjusting the volatility
5:50
So do we think volatility is going to expand or do we think it's going to contract? To actually see how that's going to work and how it's going to play out
5:57
and since you're using this page, you are probably going to be using it to trade options
6:01
Let's go ahead and put on a hypothetical trade on, let's say, Google for a second
6:06
I'll do that by simply coming up here to the trade tab in the upper left-hand corner
6:10
and then coming down here below and we're going to go ahead and throw in Google
6:15
G-O-O-G. Coming down below, let's say we wanted to buy a long vertical call spread on Google
6:21
And for this one, we'll go out about, let's say 32 days, 21 October
6:26
We can then come down here below and actually select the strikes that we wanted to buy and sell
6:31
So in order to create the long vertical call spread, we first need to click on the ask of the option we want to buy
6:36
And for this one, let's say we wanted to buy the 104 call
6:40
I can then come back up here and scroll down. and now we just need to sell a further out of the money call
6:46
And for this one, let's say I want to do a 5-point-wide call spread
6:50
So I'm going to come down here and hold down the control key on the keyboard, then click on the bid price of the 109 call, currently trading for $1.90
6:59
Once I do that, it'll actually build out the vertical call spread down here below
7:03
and right here it says we would be doing this vertical call spread for about $2.3
7:08
In order for us to actually yze it and put it on the risk profile page
7:12
I am simply going to right click anywhere on this green line. I'm then going to come down below in the drop-down menu and select yze Trade
7:21
You'll then see it takes us immediately back to the Risk Profile page
7:24
and now we can yze the risk for this vertical call spread on Google
7:28
You may notice it does look slightly different than the previous example because in the previous example, we only had a purple line up here
7:36
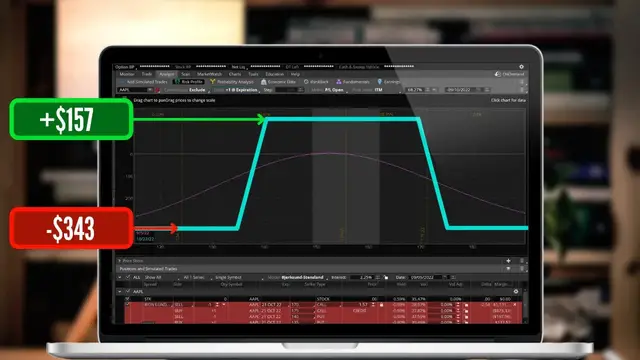
But now you can see we got a blue line and a purple line The blue line is actually going to be our profit and loss the time of expiration whereas the purple line is the one that we can play with a little bit That the one that can factor in things like time decay or volatility changes and that what we going to be making
7:52
here in just a second. But focusing first on that blue line to make sure you really get the hang of it
7:58
here we can actually see how much money we would make or lose on this vertical call spread if we
8:03
held it all the way till expiration. Here at the top, we can actually see that blue line plateau
8:08
and that blue line is going to plateau wherever we sold that short call option
8:12
In this case, it's going to begin plateauing at 109. That is visually showing us that no matter how high Amazon goes
8:19
even if Amazon were to go all the way up to, let's say, 117 a share
8:23
we are never going to make more than that plateau amount. Coming down and looking in the lower left-hand corner for a second
8:29
you'll actually see it tells us a specific value. And it's telling us the most we could ever make on this trade is going to be $297
8:36
bucks. That's also going to assume you're holding this vertical spread all the way through
8:40
expiration and you're letting your options expire. That is the only way you would ever make the
8:45
max profit on this vertical spread. Coming over to the left, we can also see the max risk on this
8:50
vertical spread if we held it till expiration. And if we come over here to the left, we can again
8:55
see that line starts to plateau right here at 104. And that's because that's where our long call
9:01
is at. So again, here it is visually showing us that the absolute most we could ever lose
9:06
on this trade is going to be 203 bucks. We could also move our mouse between those two levels, between 104 and 109, and we can see
9:14
there's a little bit more nuance to the position, because obviously we don't have to take
9:18
the max profit or lose the most amount of money possible on this trade, we could get something
9:23
in between that. So right now at the moment, it's saying if Amazon was at 106.53 per share on expiration
9:30
I would only make $49.86 on this position. Moving my mouse a little bit further to the left, I can see now down at the bottom
9:39
it is saying if Amazon was at 10528, I would actually be losing about $74 on this trade
9:45
Coming down to the bottom, we can even see the price slices are showing us a little bit more info about this position
9:51
So here it's telling us what our bullish or bear's delta is, our gamma, theta, and Vega
9:56
as well as how much we would be up or down on that position. So as of right now, if we just look at the current price, the current price of
10:04
Google in this case, we could see my current Delta is about 1835. So that is simply telling me how
10:10
bullish or parish I am. And in this case, because Delta is a positive number, and in this case it is
10:15
18, it is telling me that for every dollar Google goes up, I'm going to make about 18 bucks
10:21
Coming to the right, we can also see that since our gamma is a positive number, even though it is a
10:26
very tiny positive number, it is telling me that I'm going to make a little bit more money for
10:30
every additional dollar. To the right of that, we can also see I currently have a negative theta
10:36
meaning as of right now, where the stock price currently is, I'm going to be losing about $1.19 a day
10:42
due to time decay. Now, finally, to the right of that, we can also see how Sensena I am to volatility
10:47
changes. And because Vega is a positive number here, it is telling me that I want volatility to
10:53
increase. For every 1% change in implied volatility, I'm going to make about $1.46 on this trade
10:59
So hopefully you can see that this information can be pretty useful if you're trying to manage your Greeks effectively
11:04
or just see the overall risk on a trade, or if you're even just learning how to do a strategy
11:09
it's kind of nice to see exactly how this trade is going to make us or lose us money
11:13
and this visualization right here really helps. But again, just as a little recap, the blue line is the date of expiration line
11:20
It is how much we are going to make or lose if we hold this spread through expiration
11:25
The purple line, on the other hand, is the one that has a little bit of flexibility, That line is telling us our profit and loss on the position based on some of our inputs So looking at it right now this purple line is telling us how much we would be up or down on this new Google spread today if the stock price went up or down
11:43
So coming over here to the right a little bit, if we were to look at the current price of Google at 112, we're saying if Google went up to 112 today, we would only make $156 on this trade
11:54
Now, if it were to go down and it went down quite a bit, let's say it went down to $99 a share
11:59
share, we can actually see we would then be down only $63 today. But what's really cool about this is, is that we can
12:06
actually price in things like time decay and things like volatility changes
12:10
So for example, how much would we be up or down on this vertical spread if we were
12:14
to fast forward in time two weeks and if we were to price in a 10% decrease in volatility
12:21
So factoring in two weeks worth of time decay or theta decay and pricing in a decrease in
12:26
VAL or a decrease in volatility. So to do that, we will first come down here to the calendar icon in the lower right hand corner and I'm
12:33
going to go ahead and fast forward about two weeks in time so since today is the
12:38
19th we're going to go to October and we'll come down here and select October 3rd
12:43
about two weeks out in time I could also come down here to the little gear icon
12:47
in the lower right hand corner and now I've got a little volatility
12:51
adjustment tab and what I'm going to do is highlight that and price in a 10
12:56
decrease in volatility so now that we've got both of those priced in, if we were to come back up here to my price slices, we can actually see that
13:04
everything has changed. I've got a brand new delta, new gamma, theta, Vega, and it's showing me a
13:10
brand new P&L open if today was October 3rd. So you can see here, if I were to fast forward a
13:16
couple weeks in time, if I remember correctly, my delta was only about 18, and now it's selling
13:21
me it's about 20 nights. And now overall, technically, I'm more bullish on this trade. My delta
13:25
has increased. I can also see by coming over here to the right, I'm also being affected more by
13:31
time decay. I'm losing about $2.82 a day due to time decay. Coming up above those price slices
13:37
we should also notice that our purple line has been adjusted. It has actually moved to factor in those
13:43
changes in time, in volatility, and now we can see how much we would be up or down on October 3rd
13:49
if Google was at a specific level. So if we were to put our mouse, let's say right here at 107
13:55
we are now saying that if today was October 3rd, I would currently be up $86.97 on this trade if Google was at 107.15
14:06
Coming over the left, if we were to just go to the current price, and I were to hover my mouse here at roughly 103.16, it is currently telling me I would be down about 40 bucks if Google were to do absolutely nothing
14:19
Coming back down to the lower right, if we were to continue pricing in additional days of time decay, you're actually
14:25
actually seeing that purple line is continuously moving to kind of match the blue line
14:30
And eventually we can't factor in any more time, any more volatility
14:35
So eventually those two lines will actually overlap one another. And that means we have no more time, no more volatility left
14:42
I know that seemed like a lot, but with a little bit of practice, I promise who you will get the hang of this tool
14:48
It'll take time and I'll be sure to make more videos on this to cover it on different strategies
14:52
and see how those strategies would actually change. But in the next one, I do want to go more in depth
14:58
on how to use this to manage your overall portfolio of positions rather than just one at a time
15:03
Hopefully, after all that, you do feel a little bit more comfortable with the risk profile tab and its basic functionality
15:09
But if you do still have questions or recommendations for other video topics
15:13
just let me know down below. And also, if you were looking to learn more, YouTube seems to think you'll find this next video helpful as well
15:20
so go ahead and check it out. But that's it for now. Have a great rush your week everyone and I'll catch you on the next video
#Business & Industrial
#Business Finance
#Finance
#Finance
#Investing
#Stocks & Bonds
#Jobs & Education
#Risk Management
#Asset & Portfolio Management