Up next in 10


Today we’ll be quickly covering Level II and Time & Sales within ThinkorSwim. These two tools will let us get a better look at a stocks liquidity and supply and demand in real time.
Level 2 is essentially the order book. It’s simply a list of all the open orders out there to buy and sell the stock right now. Time and sales on the other hand is a list of all the trades that have already filled and the prices they filled at.
Show More Show Less View Video Transcript
0:00
Today we'll be quickly covering Level 2 and Time in Sales within Thinkorswim
0:04
These two tools can allow us to get a better look at a stock's liquidity and supply and demand levels
0:09
in real time. Level 2 data is essentially the order book. It is simply a list of all of the
0:15
open orders to buy or sell the stock right now. Time in Sales, on the other hand, is a list of
0:20
all the trades that have already filled and the prices that they filled at. Now don't worry, we
0:25
will be going through this one step at a time to make sure you really get the hang of it
0:29
and know how to read what it is we're looking at here. If this is the very first time you've heard about these tools
0:35
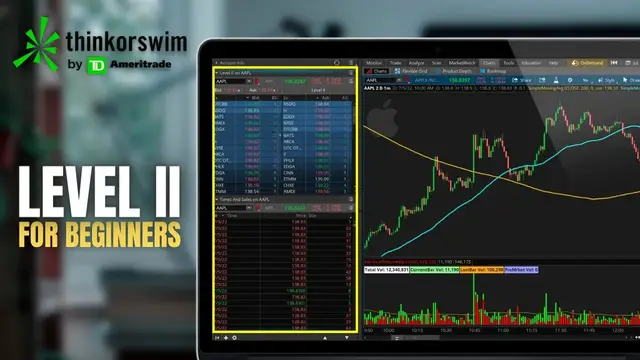
this is what they look like. Down here on the lower left, you've got the level two data
0:40
Then over here on the lower right, you've got the time and sales. If you don't have either of them on your own screen right now
0:45
you can add them in a few different ways. One of which is by simply adding them to the flexible grid like you see here
0:52
or you could add them to your side panel over here on the left hand side. Now beginning with adding them to our flexible grid over here on the charts page
1:00
let me first come up here to the upper right hand corner and reset my screen so we can start fresh
1:06
So now looking here you can see I have reset my flexible grid and if you come to the screen for
1:11
the very first time this is exactly what you'll see. So right up here at the top I've got one big
1:16
chart then I've got three little charts down here below and the very first thing I want to do is
1:21
actually delete one of these charts by hitting the little square with a line through it. Now
1:25
I've got the right number of charts for what I want to do, I'm going to come back up to the upper
1:29
right hand corner and click on the grid icon. I'm then going to come down here and deselect the
1:34
customized grid and you'll notice that that gets rid of those little pop-up windows in the center
1:39
of the screen. Later if you wanted to add additional charts to your flexible grid you would just come
1:43
here and select that once again and now you could add more charts to your window. But once we actually
1:48
get rid of those the very next thing I want to do is link all of these charts together. Link them all
1:53
the same color. So we'll begin by linking this one to red up here and then the bottom two to red as
1:58
well. And that's going to make it so if I change one of these charts, they are all going to change
2:03
to match. So for example, if I were to come to this chart and change it to Google, G-O-O-G, and
2:08
hit enter, you'll notice that the two other charts change to Google as well. And then if I were to
2:12
flip it back to Apple, A-A-P-L, you'll notice they change back to Apple. So now that we've got
2:18
everything linked up, the very next thing I need to do is actually put the level two data in the
2:23
lower left-hand screen and then the time and sales in the lower right. So to do that we'll simply look
2:27
at the toolbar on the right-hand side of each of these charts and I'm going to start by actually
2:32
getting rid of the chart by deselecting the letter C. Now that I've got a blank screen here to work
2:37
with I'm then going to come down here and then click on the level 2 data. Then I'm going to come
2:41
to the right and add time and sales to this one. So start by deselecting the chart then come up here
2:46
to the top and click on time and sales. So now we've got both the level 2 data and the time and
2:51
sales in our windows over here on the flexible grid. And then in order to add them to our side panel
2:57
we would come over here to the far left and hit the little plus sign in the lower left hand corner That then bring up the little gadgets menu and we can come up here and add level two data Then we could come down and add time and sales as well if we wanted to So right here time
3:12
and sales. If we were to link these up to red as well they will both flip to Apple and now here on
3:19
our side panel we're seeing the level two data for Apple as well as the time and sales. To get rid of
3:23
those since I already have them on my chart on the right hand side we'll just click on the three lines
3:28
and delete both of these. Now in terms of what we're actually seeing with the level two and the
3:34
time in sales, you can actually see these numbers are changing in value very, very quickly
3:39
Everything's flowing. Everything's changing constantly. So to make it a little bit simpler
3:43
to understand, I am in an on-demand account right now. So what I want to do is come up here and
3:48
pause the screen so that we can just have a static page and I can explain what it is we're
3:53
looking at here. Beginning with the level two first, let's go ahead and discuss how to read it
3:58
before we talk about how to use it. First off, it'll be important to remember it is simply a list
4:02
of all the open orders to buy or sell the stock right now. Here on the left hand side, we can see
4:08
the bid column and that is all of the open buy orders right now. Whereas the asking column over
4:13
here on the right hand side is all of the open sell orders. So again, the bid column is to buy
4:18
the ask column is to sell. The numbers that you're going to see in the ask size column
4:22
which is that AS, or the bid size column, which is the BS, are basically the size of those orders
4:28
So how many shares are people trying to buy or sell at those specific prices? Within Thinkorswim
4:34
this is going to be in hundreds of shares. So you're going to need to add two zeros to whatever
4:38
number you see right here. You'll also be able to see the exchange that those orders are resting on
4:43
on the far left-hand side of both the bid columns as well as the ask columns. So right here we can
4:48
see it's resting on the BATS exchange, the NASDAQ, Adjax, and honestly that's not going to be super
4:54
important for everyone watching out there, but that's what it means. Now looking at the very top
4:58
of your level 2 data, you're going to notice the very best orders to buy or sell the stock right
5:03
now, and that is also known as the level 1 data. Essentially it's the absolute best bid and the
5:09
best offer out there to buy or sell the stock right this very second. So right here we can see
5:14
the best buy order is out there at $138.43 and it's in order to buy 200 shares. To the right we
5:20
can see the best ask size or best ask price is $138.44 meaning somebody out there has a sell order
5:27
to sell 400 shares at $138.44. The difference between those two prices, the difference between
5:33
the best bid price and the best asking price is going to be known as the spread. You'll hear that
5:39
mentioned a lot. Other traders referencing the bid ask spread and using it as a way to gauge or
5:44
measure liquidity and it's basically how easy it's going to be to get in or out of the stock
5:49
quickly. So looking here we can see the current spread is going to be the current asking price
5:54
$138.44 minus the current bid price $138.43. So in this case the spread is only a penny wide
6:01
Generally the tighter that spread or the closer those two numbers are together the better The further apart they are or the wider the spread the more illiquid the stock or the more volatile the stock Now that will be changing constantly throughout the day and when we hit play
6:16
again, you'll see that it's fluctuating constantly. It's always changing, but it's especially important
6:20
to watch out for it if you're trading more illiquid products like penny stocks or options
6:25
Those type of products can have incredibly wide bid-ass spreads at times, which can make it
6:30
incredibly difficult to trade them effectively. Now if we were to look at this stock specifically
6:34
Apple stock in this case, it is clearly very liquid. If we wanted to buy it right this very
6:39
second, we could buy it at $138.44. Then if we had to turn around and sell it right away, we would
6:44
sell it for $138.43. Essentially, we'd only be losing one penny per share if I had to buy or
6:50
sell it immediately. You could also think of it as the minimum amount of movement that you would
6:55
need just to get back to breakeven. So again, if I were to buy Apple stock right now at $138.44
7:00
I'll essentially need Apple to move up a penny just to get back to break even, just to get my
7:05
money back. So if those numbers were to widen out, if they got wider and wider from one another
7:10
let's say it was something crazy like 138 by 139, I'd essentially be losing a dollar instantaneously
7:17
because if I had to buy it at 139 and then sell it immediately at 138, I'd be losing a dollar
7:23
Or I'd essentially need the stock to go back up a dollar just to get my money back because if I
7:27
bought it at $139, the bid price would need to come back up to $139 for me to sell it. So that's why
7:33
you're going to hear people harp on liquidity so often. They're going to harp on really tight bid
7:37
ask spreads because it makes it so much easier to get in and out of the stock if you've got a tight
7:42
spread. The wider the spread, the more difficult it's going to be to get in or out of it quickly
7:47
or at a fair price. And that's why options or penny stocks can be a little bit difficult sometimes
7:52
So just as a quick recap, the order book or level two data is going to reflect all of the open
7:57
orders to buy or sell the stock. Not orders that have actually filled, but open orders. Time and
8:03
sales on the other hand, if we come over here to the right, will give us a real-time look at all
8:08
the actual trades that have actually filled. So from left to right, we can see the date and time
8:12
of that order. Then we can see the price that that order filled at and the size of that order
8:17
For time and sales, the size that you see in this column is the actual quantity. So no need to add
8:22
zeros here. If you see one, that is one share. If we see 85, that is 85 shares. You'll also notice
8:28
that within time and sales, some of these numbers will be in green, some of them will be in red
8:32
and that is simply where the trade filled at. If the order happened at the ask, it'll be in green
8:37
If it happened at the bid, it'll be in red. An easy way for you to think about it is if it's in
8:42
green, somebody was buying. If it's in red, somebody was selling. Just remember that someone buying
8:47
could be buying them to go along the stock, or they could be buying to cover a short possession
8:51
Then vice versa, selling could be someone selling their current position or shorting the stock
8:56
But again, time in sales is simply a list of all the trades that have already filled and the time and prices that they filled at
9:03
In terms of actually using these two tools in your trading it be mostly used by those you active traders or even scalpers out there who want to go in and out very very quickly It generally going to be used to find very short term opportunities and potential support and resistance levels So if we were to take a look at level 2 data we might find
9:21
some large orders stacked up to buy or sell this particular stock at a certain price. Meaning that
9:27
those large buy or sell orders could actually act as a level of support or resistance because it's
9:32
going to be difficult to break through those very large orders. Now if it does break through, it
9:36
could actually lead to a short-term breakout to one direction or the other. The only real problem
9:41
with level two inside of here is that it doesn't give us the full depth of each of these exchanges
9:45
We're only going to see the aggregate of the best orders on those exchanges, not the orders behind
9:50
them. For example, if we were to look here, we can see the best order out there currently is on
9:55
the NASDAQ to buy 200 shares at 138.43. But if we were to actually open up the full NASDAQ order book
10:02
I'm sure there's a lot of orders on the NASDAQ at 138.42 or 138.41 and so on going all the way down
10:08
So using level two data, I can't see where those orders are stacked up on the NASDAQ
10:13
on the ARCA, on Amex. And that's where a new tool that's been added to Thinkorswim is going to come in real handy
10:19
And I'll save this for a later video, but it is called Bookmap at the very top of my
10:23
screen right here. This is going to be a much better tool and does take up a lot of processing power on
10:28
your computer, but it'll show us the entire depth of all of those exchanges. So we'll be able to see all of the orders stacked up
10:35
But moving on to time in sales, if we see down here, we might be able to use this to see a series of prints to one side or the other
10:42
telling us there could be an imbalance in the supply and demand on one side
10:46
So for example, if we saw a long string of green prints or buyers
10:49
that could be telling us that the momentum is beginning to build and potentially push the stock price up even further
10:56
If we instead saw a bunch of prints at the bid or a lot of red lines coming across our screen
11:00
that could be telling us that momentum is building to the downside and we could see a downward shift in the stock price. Now within time and sales I would make a
11:08
slight adjustment to what we're looking at here by coming up here to the size filter in the upper
11:13
right hand corner and if we come down here we could customize the size that we're seeing and
11:18
that's going to hopefully get rid of a lot of noise that we're seeing across our screen. All of those
11:22
orders to just buy one or two or five shares that are not really important to us. So what we're going
11:27
to do is come down here and select a custom size filter and for right now in this minimum box I
11:33
only want to see orders to buy or sell over 100 shares at a time. So now I'll hit enter to lock
11:38
that in. And now looking here, we can see only those orders above 100 shares are reflected in
11:44
the time in sales. And again, hopefully getting rid of a lot of that noise. But I know time in
11:49
sales and level two can be a little bit confusing when you're first getting started. I do think
11:53
they're helpful, although I'd say don't focus on them too heavily. They're just tools to
11:57
potentially incorporate in your trading. Hopefully after all that, you do feel a little bit more
12:02
comfortable with both level two and time in sales and how they work a little bit. If you do still
12:06
have questions or recommendations for other video topics, please let me know down below. And also
12:11
if you're looking to learn more, YouTube seems to think you'll find this next video helpful as well
12:16
So go ahead and check it out. But that's it for now. Have a great rest of your week, everyone
12:20
and I'll catch you on the next video
#Finance
#Investing
#Stocks & Bonds
#Brokerages & Day Trading