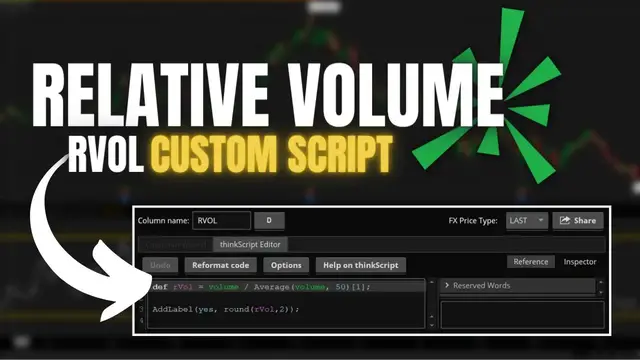
Relative Volume RVOL Custom Script for ThinkorSwim
Dec 16, 2022
Relative Volume, often called RVOL, is an indicator that compares current trading volume to average volume over a given period. This will then be displayed as a ratio so we can quickly see how active a stock is trading today in comparison to its average.
Today we’ll quickly go over how RVOL is calculated, how to load a custom script in thinkorswim to view it, and a general review of how it can be implemented in your trading. When the indicator value is greater than one, the volume is higher than average; conversely, a value less than one means lower than average volume.
Timestamps
0:00 Intro
0:25 RVOL Calculation
1:26 Loading Custom Script
4:23 How it Works
5:03 Outro
➤ Open a tastyworks account: https://start.tastyworks.com/#/login?referralCode=PKSKCFVD2J
➤ Start Investing with M1 Finance: https://m1finance.8bxp97.net/151KXm
Disclaimer: Some of these links go to one of my websites and some are affiliate links where I'll earn a small commission if you make a purchase at no additional cost to you.
Show More Show Less #Business Education
#Finance
#Investing
#Stocks & Bonds
#Stocks & Bonds
#Brokerages & Day Trading

