Up next in 10


The Stochastic RSI is another popular technical indicator used to gauge momentum and identify overbought or oversold conditions. It’s essentially an indicator of another indicator, basically used to measure RSI relative to its own range.
Today we’ll be doing a breakdown of how the indicator is calculated, how to find buy sell signals using the stochastic rsi, and how to create a custom scan to find stock that meet these buy or sell criteria right now.
Timestamps
0:00 Intro
0:41 Stochastic RSI Explained
3:00 How to Trade StochRSI
4:22 Custom Scan
9:08 Outro
➤ Open a tastyworks account: https://start.tastyworks.com/#/login?referralCode=PKSKCFVD2J
➤ Start Investing with M1 Finance: https://m1finance.8bxp97.net/151KXm
Disclaimer: Some of these links go to one of my websites and some are affiliate links where I'll earn a small commission if you make a purchase at no additional cost to you.
Show More Show Less View Video Transcript
0:00
The Stochastic RSI is another incredibly popular technical indicator used to gauge momentum and
0:05
identify overbought or oversold conditions. It's essentially an indicator of another indicator
0:11
basically used to measure RSI relative to its own range. As you'll see here in a minute
0:16
it is incredibly similar to RSI, however it's generally more of a fast-moving indicator
0:21
giving us more potential buy or sell indications. Today we'll be doing a quick breakdown of how the
0:26
indicator is actually calculated, how to find potential buy or sell signals using the Stochastic
0:31
RSI, and how to create a custom scan to actually find those stock that meet these buy or sell
0:36
criteria right now. Quickly running through the calculation of what we're actually looking at
0:40
right now, Stochastic RSI is equal to the current RSI minus the lowest low in the RSI divided by
0:47
the highest high minus the lowest low. Now depending on the platform that you're using
0:52
this will then generate a value somewhere between 0 to 1 or 0 to 100. Really, it's not that important
0:58
it'll just depend on how your platform chooses to express the value. Now, if the value of the
1:03
stochastic RSI is equal to 0, it would mean that the RSI is at its lowest level in the last 14 days
1:10
If it was equal to 50, it would mean the RSI is right between its 14-day range. And then finally
1:15
if the value is equal to 100, the RSI is at its highest level in the past 14 days. Looking here
1:21
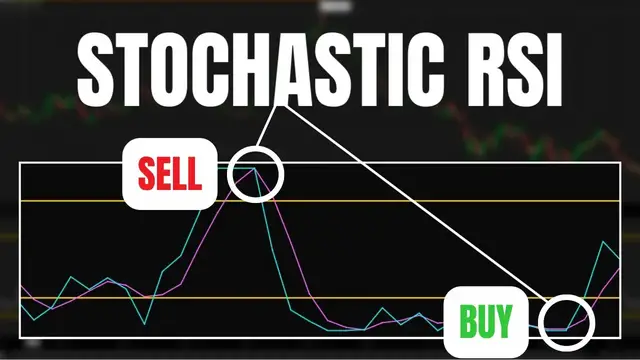
at the indicator itself, you'll notice that the percent K line is the blue line, whereas the purple
1:26
line is going to be the percent D line. The blue line is the actual stochastic line, showing us the
1:31
current value of the stochastic RSI. The purple line, on the other hand, is the three period EMA
1:36
of the stochastic line. Many traders may choose to use the crossovers of these two lines as their
1:42
potential buy or sell signals, but I'm going to touch on that a little bit later. Besides the lines
1:47
you'll also notice the zone I've highlighted in the center between the ranges of 20 and 80
1:52
Like the RSI, the stochastic RSI can also be used to identify potential oversold or overbought
1:58
conditions. Traditionally, anytime the indicator is below 20, it is said to be oversold. Anytime
2:04
it's above 80, it is said to be overbought. However, we will not use a simple oversold or
2:09
overbought indication in and of itself as our buy or sell signal. There will be many times in which
2:15
you see a strong uptrend and the stochastic will remain in an overbought condition without any downward moves Conversely in a strong downtrend you may see the stochastic in an oversold condition for a very long period of time without any upward moves
2:28
This is because the stochastics are a fast-moving study, and they may give us numerous false buy or sell signals that we really need to be wary of
2:36
So generally, when utilizing the stochastic RSI, we'll also be very mindful of the overall trend in the stock
2:43
We're only going to be searching for oversold conditions and crossovers when the stock is in an uptrend. Then on the short side, only searching out overbought conditions
2:51
and a stocasic crossover in a downtrend. A somewhat helpful and quick way for us to see
2:56
the overall trend in the stock is through the use of moving averages. In this case
3:01
we'll specifically be using the 21 and the 50 period exponential moving average lines
3:06
Looking here, you'll notice that the teal line is the 21 period EMA and the yellow line is the 50
3:11
period EMA. Generally, when we see the moving averages pointing up and the 21 period EMA above
3:17
the 50 period EMA, we can determine that the stock is in an uptrend. Looking on this chart
3:22
specifically, we can actually see several points in this uptrend when the Stochastic RSI reached
3:27
oversold territory and then had a crossover. Each of these crossovers would then be our buy signals
3:32
when it's in an uptrend. Now, conversely, looking instead at a stock in a downtrend
3:37
we can see that the 21 period moving average is trending below the 50 period moving average
3:42
We're then going to be looking for periods on which the stochastic RSI is going to reach an
3:46
overbought condition, and then there is a crossover between the K line and the D line
3:51
Again, looking at this chart, we can actually see several potential short signals in this downtrend
3:56
when the crossover occurred and where we could have actually entered a short position. So again
4:00
in this case, when the stock is in a downtrend, we are looking for a condition when the stochastic
4:05
RSI is reading an overbought threshold and then the K line crosses below the D line. So now that
4:10
we actually have an idea of what we're looking for, let's actually create a scan to find stock
4:15
that meet these criteria right now. Now in order for us to do that, we are going to come up here to
4:19
the scan tab specifically. Go ahead and select that. From there you can actually see I already
4:24
have three filters down below and I'm actually going to use these baseline filters. At the moment
4:29
you can see I'm only looking for companies that trade over $10 a share, have traded over a million
4:34
shares at the time of running the scan and are worth at least $1 billion. So using these filters
4:39
as the baseline I next going to add a study filter to look for stocks that are in an uptrend but have also recently showed an oversold condition on the stochastic RSI and a recent crossover
4:50
In order for us to do that, we are going to come over here to the add a filter box in the upper
4:54
right hand corner. Go ahead and select that. I'm then going to come down and specifically select
4:58
a study filter. I'm then going to come over here to the default filter, ADX crossover, and go ahead
5:03
and select that. Looking down below here, this is most definitely going to be a custom filter. We're
5:08
going to have to write this one ourselves. We'll then see a little pop-up window come up. Let me go
5:12
ahead and drag that down so you guys can see it. The very first thing I need to do is go ahead and
5:16
delete whatever's in here. Start fresh. Now the very first filter we're going to add is actually
5:21
looking for stocks that are an uptrend. To find these, what I'm going to look for is stocks where
5:25
the 21 period EMA is currently greater than the 50 period EMA. Now this won't be perfect, but it is
5:30
our starting point. So let's come down here and add a condition. We're going to select a condition
5:35
it's going to be a study condition. I'm going to go ahead and search for exponential moving average
5:39
in here and select it. I then need to come down here and specify that this is going to be the 21
5:44
period EMA. I'm then going to come over here and specify that I want it to be greater than
5:49
the 50 period EMA. Let me go ahead and find that next. And then all I have to do is change this
5:56
from 9 to 50. Now that I'm happy with that I'll simply hit save and we still have a lot of work
6:02
to do. I'm going to then come down here and add another condition. For this next one, we're going
6:06
to look for stocks that were recently oversold on the Stochastic RSI. So what I'm going to do is
6:11
come up here to select a condition. It's going to be a study condition and we're going to search for
6:15
Stochastic RSI and go ahead and select it in the list here. I'm going to go ahead and leave it as
6:21
the default values. Of course, if you guys need to change this, some people prefer to use the 10
6:25
period Stochastic RSI. This is where you would change that right here. But in my case, I'm fine
6:30
with it. And all I'm going to do next is come over here and select is less than. I'm going to select
6:34
a value condition and then change this to less than 20, which remember is oversold on the Stochastic
6:40
RSI. Now that I'm happy with that, I'll simply come down here and select save and we're almost
6:46
done. The next thing I'm going to do is look for that Stochastic crossover. So finally we'll come
6:50
down here and add another condition and I'm going to run through this pretty quick. I think you guys
6:54
get the general idea of how to do this now. We're looking for a stochastic
6:59
crossover of the K crossing the D So right here you notice I got the K on the left side then going to say crosses above the stochastic RSI as well But this time I looking for it crossing above the D line
7:14
And I am going to say it had to have happened in the last day. So we're going to leave right here where it says within one bar and we're going to go ahead and hit save. I'm going to leave this as
7:21
the daily aggregation and I'm just going to come down here and select OK. So now that I'm happy
7:26
with that and we've essentially created a scan that are looking for stocks that are in an uptrend
7:30
but are also oversold on the Stochastic RSI, but have also had a recent crossover
7:35
If we wanted to find those companies that match all of those criteria right now
7:38
let's just come over here and hit scan. Looking down below, you can actually see there are 10 companies that actually match my criteria right now
7:46
And in order to test this, let's actually look at a couple of them. So looking down here, we can see CTRA
7:52
Let me go ahead and pull up a chart and throw in CTRA up there
7:56
Taking a look over here, let's go ahead and zoom in just a little bit. At the moment, to me, it does look like the stock is in an uptrend, at least generally speaking
8:03
We can see that the 21 period EMA is above our 50 period EMA, so it matches our criteria in that
8:09
regard. Looking down below at the stochastic RSI, we can see it is in an oversold condition. It's
8:14
below the 20 line currently. And looking down below there, if I were to highlight it, it actually
8:19
just recently had a crossover in the last day. So as of right now, at the time that I ran this scan
8:24
CTRA meets all of my buy criteria. Now, of course, that won't always be the case if I were to come
8:30
back here to the scan tab and let me take another look at one of these guys. Let's throw in MAR
8:36
Let's go ahead and double check this one. MAR. Again, coming over here to the right hand side
8:41
we can see that to me, this looks like it's more of in a downward trend. Even though the 21 period
8:46
EMA is above the 50 period, it doesn't look like it's still got some upward momentum to it. However
8:52
to our scan, this does meet our search criteria right now. The 21 period EMA is above the 50
8:58
the Stochastic RSI is oversold, and there was just recently a crossover in the past day. So again
9:04
to me, this one would be a little bit iffy, but technically it does meet all of our scan criteria
9:09
But I think this was a fairly comprehensive introduction to the Stochastic RSI and the
9:14
different ways you guys can use it in your trading. If you have any additional questions
9:18
for me or recommendations for other studies you guys would like me to discuss, please leave them
9:22
down below. But that wraps up today's video on the Stochastic RSI. I hope you all have an amazing
9:27
rest of your week, and I'll catch you on the next one
#Finance
#Finance
#Investing
#Stocks & Bonds
#Financial Markets News