Up next in 10


Today we’ll be diving into the thinkorswim platform to learn the fastest ways to trade in and out of your futures contracts.
Futures are certainly not for everyone, and honestly the majority of you watching this probably shouldn’t even be considering it. They’re are incredibly leveraged, are not standardized from one to the next, and have specific dates they expire, meaning you can yourself in a lot of trouble if you’re not being careful.
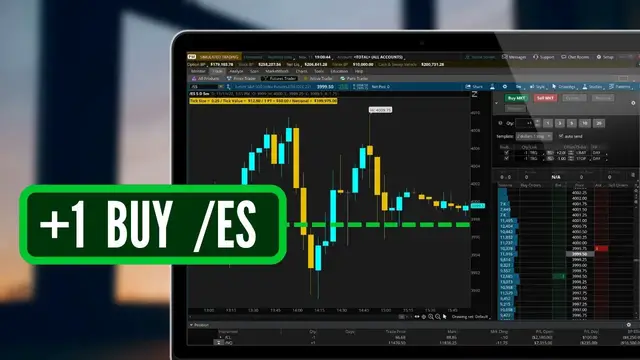
Today we'll go over the active trader and how it can be used to place your trades much more quickly. We'll also be adding a futures script to quickly view the futures tick size, tick value, and notional risk.
Show More Show Less View Video Transcript
0:00
Today, we'll be diving into the Thinkorson platform to learn the absolute fastest ways
0:04
to trade in and out of your futures contracts. Now, futures are certainly not for everyone
0:09
and honestly, the majority of you watching this probably shouldn't even be considering it
0:14
They are incredibly leveraged, are not standardized from one to the next
0:18
and have specific dates that they expire. So that means you can get yourself into a lot of
0:22
trouble if you're not being careful. However, what they do do is give you the ability to trade
0:27
commodities directly. So things like oil, gold, or even corn. And because they're not held to the
0:33
PDT rule, those of you with an account less than $25,000 can day trade them as often as you want
0:40
So for those of you who are still interested in learning more, we are going to go over a couple
0:44
tools within Thinkorswim that'll allow you to trade them far more quickly. I've already discussed
0:49
a bunch of these tools many times in the past and specifically the Active Trader tool, but I've had
0:54
a crazy amount of requests to go over it and specifically go over how to use it for trading
0:58
futures. So that is exactly what we're going to do. Now within thinkorswim there are actually a
1:03
few different places that we can open up the active trader tool. But for now we're going to
1:08
head up here to the trade tab which I already have opened. Then come on over here to the right
1:13
and specifically open up the futures trader. Just keep in mind you don't have to come to the futures
1:18
trader to trade futures within thinkorswim. You can essentially do it on every single screen. But
1:23
We're going to do it here for right now. Looking down below at the futures trader at the moment
1:28
it actually looks like a bit of a mess. So I'm going to go ahead and clean it up
1:31
by coming up here to the grid icon in the upper right-hand corner, this little bundle of squares
1:37
Within the little menu below, I can then select how many charts I wanted to see
1:41
And in this case, I'm going to keep it simple by simply coming down here and selecting one square or one chart for right now
1:48
Now that already looks a lot more organized, but what I now want to do is come over here
1:52
to the far right-hand side of the chart and deselect the trade button
1:56
as well as the dashboard button down here below. Then what I wanna do is come up here and select a chart
2:01
because I do wanna see the chart of the futures contract that we're trading. And then come up here
2:06
and open up the active trader tool as well. We'll now be able to see the tool over here
2:12
on the left-hand side. And before we even jump into it, let me first come up here to the top
2:16
where it currently says price and widen out this column just a little bit
2:21
That way I can now see all the prices listed down the center
2:25
And just looking at the tool itself, you'll notice that it does display a lot of information
2:29
But let's first start with the buttons right up here at the top. Now these default buttons can actually be customized
2:35
but the ones that we have here currently are going to allow us to quickly enter or exit our futures positions using market orders
2:42
The first two here are pretty straightforward. Hitting the buy market button will submit a market order to buy a futures contract
2:49
Hitting the sell market button, we'll submit a market order to sell or short this futures contract
2:55
Now, if we already had orders out there to buy or sell this particular future
2:59
we could cancel them by coming over here to the right and hitting the cancel button
3:03
So that'll cancel any working orders to buy or sell this futures position
3:07
Now, if you are already in a futures position and you feel it's reached the tipping point
3:12
and it's about to head in the opposite direction, you could come over here to the right and hit the reverse button
3:17
This will immediately close out your current futures position and then open up a brand new one on the other side
3:23
So for example, if you were long two contracts right now and hit reverse, you would not only sell the two that you currently own, but you would also go short another two on top of that
3:32
So essentially hitting reverse is going to completely flip your position. If you were bullish before, you're now bearish
3:38
If you were bearish before, you're now bullish. Now if we instead come over here to the right to the last button in the list here, the flatten button
3:45
this is going to be used to completely get you out of your current position and cancel any working
3:50
orders. So whatever you're currently holding, hitting the flatten button is going to completely
3:54
get you back to zero So if you had two contracts you hit flatten you now have zero If you had 10 contracts and you hit flatten you back to zero But besides the big buttons themselves we could also come over here to the left and click this little drop arrow to open up the menu down below
4:11
And this is going to give us a few more customizations. The first of which here is the quantity box, where we can specifically specify how many contracts we wanted to buy or sell anytime we click those buy or sell buttons
4:22
We could either come here and type in exactly how many contracts we wanted to buy or sell
4:27
or we could use these little buttons on the right and just quickly taper up or taper down the quantity right here
4:34
Moving to the right of the quantity, we also have a button that's going to allow us to create a much more advanced template
4:39
So that'll allow us to not only buy a futures contract, but also simultaneously place a closing trade along with it
4:46
That would be something like a bracket order, which we will discuss a little bit later
4:50
but it's essentially when you go into a trade already knowing exactly what you want your profit target or your stop loss target to be
4:57
But now besides that, the final button right below that is the auto send button
5:02
And that'll essentially allow us to bypass order confirmations. So currently with it unchecked, if we were to come up here and go and place a trade
5:10
like if I were to click buy market right now, you'll see a little order confirmation box appears down here below
5:16
So I first would have to come here and just make sure everything looks right. And then to submit it, I would then have to come down here and hit send
5:23
If we instead came up here and checkmark the auto send button, that is going to get rid of that confirmation. So now if I were to come up here and hit sell market
5:31
that contract is going to be immediately sold. So if you wanted to bypass that confirmation and
5:37
maybe save yourself a couple more seconds you could check mark the auto send button
5:42
To see it one more time if we were to come up here and check mark buy market you'll now see
5:46
that I instantly bought a futures contract on NQ. We can also see down below it also tells us our
5:52
current position information. So right here in the first box, it tells me the current size of
5:57
this position. In this case, I currently have one contract. To the right of that, it tells me exactly
6:02
what I bought that contract for. So in this case, $11,470, spot 5,0. Then to the right of that
6:09
it also tells me how much I am currently up or down on this specific contract. So I'm currently
6:14
down $5 since purchasing it. To the right of that, the P&L Day column, it currently shows the exact
6:19
same information, currently telling me that I am up $35 since buying this contract. However
6:25
the P&L Day and the P&L Open will not always be the same because the P&L Day factors in all of
6:31
the other trades that I've placed on this futures position today. So if earlier in the day I'd
6:36
actually made another $100 trading NQ, this P&L Day would be $100 higher than the P&L Open
6:42
Because remember, it's factoring in the previous trades on NQ today. Now, other than placing market orders, at some point you'll likely want to place limit orders or stops as well
6:53
And that's where the pricing ladder down here below comes in handy
6:56
So right here, looking down the center, we can see the price of the underlying with the current bid and asking columns to the left and right of the current price
7:06
Now, in order to place a trade, you would simply put your mouse to the left or to the right of the price that you wanted to buy or sell the futures position at
7:13
So in order to buy the futures position, we would simply move our mouse to the left or to the bid
7:18
column. If we instead wanted to sell or short the contract, we would move our mouse to the right to
7:23
the red column or the asking column. You may also notice that depending on where I move my mouse
7:29
whether it be above or below the current price, it's going to change the type of order that we're
7:33
using. So when we're selling, you can see here when my mouse is above the current price, it defaults
7:38
to a limit order. However, if I move my mouse down below the current price, you can see it flips over
7:44
to a stop order. That'll be the exact opposite in the case of a buy ticket. So now if I move my mouse
7:49
to the left or to the bid column, you can now see it as a limit order when it's below the current
7:54
price. If I instead move my mouse above the current price, it flips over to a stop order
8:00
You might also be wondering what all those numbers are in the bid and asking columns Like if we come down here to the current price we can see the number four here the number one here Those are actually open orders to buy or sell this futures position
8:13
So in the green column, we can see open buy orders. In the red column, we can see open sell orders
8:19
Now, just for example's sake, so we can see how this works, let's say that we wanted to trade oil right now
8:25
So to do that, we are going to have to head up here to the symbol box in the upper left-hand corner
8:29
And right there, we're going to type in the future symbol for crude oil, which in this case is going to be forward slash CL. That immediately opens up the crude oil chart
8:38
down here below. But if you don't know the symbols quite yet, you could also come up here to the
8:44
drop down arrow. Then within this list, just come over here to the right and open up the futures
8:48
window. Within that list below, we can now see all of the available futures contracts, their symbols
8:55
as well as important info like their tick size, tick value, and their margin requirements. But now
9:00
that we have crude oil pulled up, let's go ahead and click out of this for a second. Let's say that
9:05
we were bearish on oil and we wanted to short a contract. To do that, we're just going to come
9:09
over here to the right and click the sell market button to sell a futures contract immediately
9:15
We can now see that that short position has been opened. I am now short one contract and I shorted
9:20
it at $86.68 and I'm currently not up or down. Actually, now I'm up $10 since doing that. Let's
9:26
now say I wanted to place a closing ticket. So I wanted to buy back this short position if oil ever
9:32
went down to, let's come over here to the left and say $86.50. So now in order to place that limit
9:39
order to buy back this contract, if it ever goes down to $86.50, you can see I simply put my mouse
9:44
to the left of that price, and now I'm just going to go ahead and click. I can now see it as an open
9:49
order right here on the pricing ladder, but also if we were to come over here to the chart on the
9:54
left-hand side, if I were to double-click on the chart to zoom out, I can now see that open ticket
10:00
to buy back that futures position at $86.50. Later down the line, if we wanted to edit that working
10:06
order to buy it back, we could simply click and drag it up or drag it down to the price that we
10:11
wanted to move it to. So in this case, you can see I've dragged it down now to $85.63, so now if I let
10:18
go, that open order has been adjusted down. Now in order to monitor it, we would simply come over
10:24
here to the right. And once again, we can see our open short position is still open. I haven't
10:28
gotten out of it yet. And I can see again the price I shorted it for. And now I can see here
10:33
I'm currently up $100. Now, in the case of crude oil specifically, forward slash CL
10:39
every penny move is going to be $10. Now, that'll be completely different from one contract to the
10:45
next. So they all have different tick sizes, different tick values, and different margin
10:49
requirements. That can all be a bit confusing, especially if you're an avid futures trader and
10:55
you trade a bunch of different futures contracts, whether it be crude oil or ES or NASDAQ
11:00
So to keep things simple, let's go ahead and add a study to our chart real quick
11:04
which is going to display all of that info right here on the chart. So to do that
11:09
we're going to come up here to the studies icon right above our chart. Then down here below within
11:14
that studies pop-up window, let's just come over here and search for the study that I've called
11:19
futures. We can then see it down here in the list and now in order to add it I am simply going to
11:24
click on it, hit add selected, then come over here to the right and hit okay. Just keep in mind that
11:30
this isn't a default study so unless you import this to your own platform you won't be able to
11:35
see it here. But I will post a link down below in the description of this video where you can go to
11:40
my website and copy it for yourself and then just import it into your own platform so you can see
11:45
all of this helpful info as well. But now that we've added it, let's come up here to the top and
11:50
go through it for just a second. So now this label that we've just added here is now going to show us
11:55
exactly how this specific futures contract is going to move. So again, right here, it tells us
12:00
the tick value for crude oil is going to be one penny. So oil moves in one penny increments. The
12:05
tick value to the right tells us exactly how much that one penny move is going to make us or lose us So in this case it tells us that each of those penny moves is going to be of value which then means that every one full point move is going to
12:18
be $1,000. It might also be hard to see, but the value just to the right of that, the notional value
12:24
also tells us how much oil we're controlling with one single contract. So in this case, we're
12:29
controlling just over $86,000 of oil with one single futures contract. If we instead came up
12:35
here and flip this back over from crude oil to let's say forward slash ES, which is the S&P minis
12:42
Coming down below, we can now see the label has shifted to now show us the information for ES
12:47
So the tick size, tick value, and full one point move is completely different for every single
12:52
contract. And that's where this label is going to come in real handy. Now, finally, the very last
12:57
thing that I wanted to cover is the template button back over here on the ActiveTrader tool
13:03
So right here, you can currently see it says it's marked single, which just means I want to buy or sell a futures contract alone whenever we hit a button
13:10
So that's all we want to happen. When we hit trade, we only want to buy or we only want to sell
13:16
If we instead clicked on that, you'll actually see a few different templates down here below
13:20
but the one you're probably going to be using most often is going to be the one marked trigger with bracket
13:26
That'll then open up a little window down here below where we can now adjust the trades that we want to be submitted
13:31
immediately after our opening trade fills. So after we buy or short this particular futures contract
13:38
what do we want to set as our profit target or where do we want to get stopped out at if it goes against us
13:43
So the top one we see here, the limit order, that's going to be our profit-taking order
13:48
And then the stop, that is obviously our stop-loss order. Now at the moment, we are currently saying that we want to get out
13:53
at either a dollar profit or get stopped out if it goes down a dollar
13:58
Which remember, depends entirely on the future that you're trading. So a dollar move on ES is going to be $50 on a single contract
14:05
whereas a dollar on crude oil, remember back, is $1,000. I'm instead just going to adjust the limit price up to $2
14:13
So I'm going to change this from $1 to $2. And I'll go ahead and leave the stop as $1
14:19
Now, in order to save that for future use, if it's something that I think I'm going to use often
14:23
I can simply come over here to the right and click this little save icon or the floppy disk
14:28
I'm then going to come down here and give it a name that I'll be able to remember for future use
14:34
and then come here and hit save. Once our templates have been saved, we can actually access them by coming up here to the template drop-down window
14:42
and now we can see all of the templates that we've created down below the default templates
14:47
So once you get the hang of it, definitely create a couple different templates that you do think you'll use often
14:52
and that'll save you a lot of time later down the line. but now in order to see what this is going to look like let's just come down here below and
14:59
select our template once again $2 $1 stop I can now come down here below and specify where I want
15:06
to buy this futures position at so let's say we only wanted to buy ES if it comes down to 39 13
15:12
even so I'm just putting my mouse to the left of it and clicking in that little green box you can
15:17
now see that that opening trade has been placed I am now placing an order to buy this futures
15:22
position if it ever goes down to 39.13 and now once that happens and it actually just did I just
15:28
bought it which now means these two sell tickets have now been submitted. So now I'm saying I want
15:34
to sell it if it ever goes back up to 39.15 to take that $100 of profit off the table or I want
15:40
to get stopped out if it goes down to 39.12 because I don't want to lose more than 50 bucks on this
15:45
trade. I could also see that by coming over here to the chart on the left hand side it kind of looks
15:51
like they're the same line, but if we were to zoom in a little bit, you can see both of those sell
15:56
tickets right here on the chart. But hopefully that helped to clarify a few things that you might not
16:01
have known already. Just be careful with futures. They are crazy leveraged and can get you into a
16:06
lot of trouble if you're not being careful. Now, if you want to dive deeper down the rabbit hole
16:11
of futures, you might find this next video helpful as well. Otherwise, have a great rest of your week
16:16
and I'll catch you on the next one
#Finance
#Investing
#Investing
#Commodities & Futures Trading
#Stocks & Bonds
#Brokerages & Day Trading