Up next in 10

Buy & Sell Alert Using SMA Cross Over on ThinkorSwim | Death Cross & Golden Cross Alert
Dec 16, 2022

Today we’ll learn how to create a buy or sell alert for a Simple moving average crossover. This is more commonly known as a death cross or golden cross.
An advanced alert can be used on individuals stocks, but we'll be setting our alert for an entire list of stocks to notify us if there is ever an SMA crossover. Specifically, if any of the stocks have a golden cross or a death cross.
Show More Show Less View Video Transcript
0:00
Today, we'll be going in-depth on how to create a buy or sell alert for a simple moving average
0:05
crossover, and this is more commonly known as a death cross or a golden cross
0:10
About a week ago, I did a much more generic one of these, going over the absolute basics
0:14
of what an advanced alert is and how you can do them within Thinkorswim
0:18
Afterwards, I got a ton of requests specifically asking for me to go over the SMA crossover
0:23
and how to create an alert for it. So after getting so many requests, I thought I'd just make a quick video covering all the
0:29
steps on how to create it and then afterwards if there are any more special requests just let me
0:34
know. I know this can be especially confusing when you're just getting started and then especially
0:38
when you're doing it on your own so I'm happy to help you through the whole process. Now jumping
0:42
right into creating the actual alert we can do this on an individual stock but today we'll be
0:48
creating the alert for one of my pre-made lists. I'll actually be looking for a crossover on any of
0:53
these companies over here in my options watch list. So anytime any of these companies have a golden
0:58
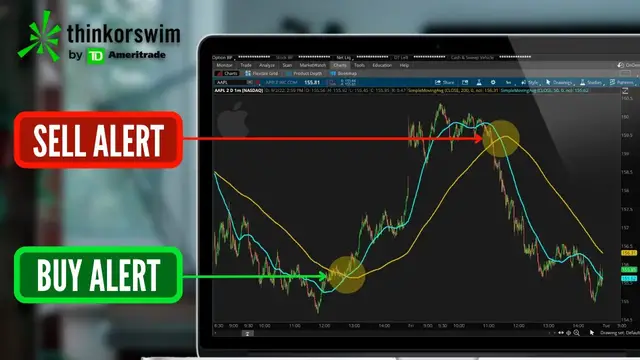
cross or a death cross, I want to be notified immediately. If you're not super familiar with
1:04
what a death cross is or what a golden cross is, we can see it right over here on the right-hand
1:09
side. Here you're going to see a blue line and a gold line. The blue line is going to be the 50
1:13
period moving average while the gold line is the 200. And when those two lines cross one another
1:19
that is going to be known as the golden cross or the death cross. Here on the left-hand side
1:23
we can see a perfect example of a golden cross when the 50 period average crosses above the 200
1:30
So that would be a buy signal. Over here on the right hand side, we can see an example of a death
1:35
cross when the 50 period average crossed below the 200. That would be a sell signal. So again
1:41
all we're doing today is setting up an alert notification to email us or text us whenever
1:45
this happens on any of the stocks in my options watch list. In order for us to do that, the very
1:51
first thing we have to do is come up here to the scan tab and actually create a scan for what it is
1:56
we're looking for. Here at the very top you can see I've already got a couple filters already in
2:01
this list. The very first of which is simply looking for stocks over a dollar per share
2:06
Then right below that we're also looking for those stocks to trade on average more than a million
2:11
shares a day. To add additional filters and remember you can add as many filters as you want
2:16
you would just do that up here in the upper right hand corner where it says add a filter
2:20
Then in the list below, we could add additional stock filters or fundamental filters or a study filter
2:26
which is exactly what we're going to be doing today to look for those crossovers
2:30
Just be mindful of where you're about to put that filter, because right now you'll notice I'm about to put it in the all of the following section
2:38
So if I were to actually put it here in the all of the following section, it would mean that all of the results have to meet all of these criteria
2:44
which what we're looking for today doesn't make a whole lot of sense. Instead, if we wanted to set one up to be one or the other, which is what we're going to be doing
2:52
Remember, we're saying it could be a golden cross, could be a death cross, either one
2:57
So we want to put it in the any of the following section. Since that exactly what we want to do we come over here to the far right and hit the add Filter box in the Any of the Following section then come down below and click on the Study Filter option We then see the default study filter appear over here on the left side and right
3:14
now it's the 80x crossover. So I don't want to use that, so I'm going to go ahead and click on that
3:18
and go down to the very bottom and select Custom. We'll then get this little pop-up window where we
3:24
can begin setting our actual parameters, and the very first thing I need to do is start by deleting
3:29
whatever it is that's currently in here. In this case, the ADX crossover. So since we don't want to
3:34
use it, we'll go ahead and hit delete. To begin adding our brand new conditions, we'll simply come
3:39
down here to the lower left hand corner and select add a condition. The very first one we're going to
3:44
be creating is going to be the 50 period average crossing above the 200. So again, the golden cross
3:50
We'll simply start by coming up here to where it says select a condition and then we need to specify
3:54
what it is we're looking for. Since we're looking for the 50 period average first, we need to come
3:59
down here and say that's a study. It's going to be the simple moving average study. So you can see
4:04
I clicked in the search box at the top and now I'm just typing in simple. Click on it in the list
4:08
below simple moving average and then you can see all of the parameters over here on the left hand
4:13
side. The only one we need to change for what we're doing today is the actual length. So we're
4:18
going to change that from the nine period average to the 50. We then need to specify we're looking
4:23
for the 50 to have crossed above. So right here in the center we're going to select crosses above
4:28
We're then going to come over here to select a condition and actually specify what it is it's going to be crossing
4:33
And in this case, it's going to be a study condition It's going to be the simple moving average just like before so we'll type in simple
4:39
Go ahead and click on it in the list And then for this one, we just need to change the length from 9 to 200
4:45
Because again, we're looking for the 50 to have crossed above the 200
4:49
Now that we've got everything filled out, we'll just come down here to the lower right and hit save
4:54
And now we've got the alert created right up here at the top, but all it's looking for right now is the golden cross
5:00
So next we have to create the death cross as well, the 50 crossing below the 200
5:05
And there are actually a couple different ways that we could do that, and I could do it either on the previous screen by creating a completely brand new filter
5:12
or I could do it right from this screen. Now since I'm not using any other studies as a reference, I'm not using MACD, I'm not using RSI
5:19
I'm actually just going to put it in this window right here. So all we have to do is come back down to the lower left and hit add a condition one more time
5:28
Since we're essentially looking for the exact same thing as before, I'll go through this a little bit quicker
5:32
It's going to be a steady condition. We're again looking for the simple moving average
5:37
And it once again is going to be the 50 period average. However, this time we're going to be looking for it to have crossed below the 200
5:45
So we'll come over here and select crosses below. We can again come over here to the right
5:49
And this time we are again going to do a steady condition. It's going to be a simple moving average condition and then all we have to do is come
5:57
down here to the length and adjust it down to 200. Now that it looks good we just come down here and hit save one more time and now we got both of the conditions in this window right now The only thing I have to do to make sure it going to work properly is come up here to the upper left corner where it currently says check if all the conditions are met
6:16
I need to click on that and flip it to any. Since remember, it could meet either of these conditions
6:21
It doesn't have to meet both simultaneously. But now that everything looks good, I'm happy with it
6:26
We'll just come down here and hit the OK button. So now looking here at what we've actually created a scan for
6:32
what it's saying is we only want to show those companies that trade over a dollar, trade over a million shares a day on average, and have had a recent SMA
6:40
crossover on a daily chart. And you can see it's a daily chart because I've got D selected on the
6:45
right hand side. You could always change that if you wanted to by simply clicking on the letter D
6:50
right there. And then you could change it to a minute chart, two minute chart, three minute
6:54
really whatever it is that you wanted to use. I'm not much of a day trader, so I'm just going to
6:58
leave mine as the daily aggregation, but that's where you could flip it. But now that we've got
7:03
pretty much everything set up, let's come down here to the scan tab and see if anything meets
7:07
our criteria so we can double check that it's working correctly. So now that the scan is run
7:12
it looks like we've got five results. And over here on the left, we can see all the symbols and
7:17
we can see what they're currently trading for today. So just to double check, it's working
7:21
correctly before we save it. Let's come down here and we'll go ahead and open up a Costco chart
7:26
So let's come up here to the charts tab and we'll throw in Costco. Now at the moment
7:31
if we were to look at the chart right now, it doesn't look like it meets our current criteria
7:36
It doesn't look like these two lines just cross one another within the past day, but that's because
7:40
we're not looking at the right chart type right now. If we look at the top of my chart at the
7:45
moment, it currently says I'm on a two-day, one-minute chart. And if we remember back
7:49
I set this for a daily aggregation. So to double check it, I'll come up here and flip this over to
7:54
a one-minute to a daily chart right here. And now looking over here on the right, we can see that it
8:00
does meet our criteria. The 50 period average just crossed above the 200. So this would be a perfect
8:06
example of when a text message would be sent to me saying hey Costco meets your buy criteria. There
8:11
has been a recent golden cross. So now that we've confirmed it's working correctly let's go back to
8:17
the scan tab and then finally the last thing we need to do is actually specify that we only want
8:22
this looking in our options watch list. So right here to do that we will come up to where it says
8:27
scan in all stocks currently. Go ahead and click on that. We'll then look below in my personal list
8:32
of watch lists, then come over here to the right and find the one that I've marked options. Since
8:37
that is the one I wanted to use, you can now see that if I were to run this scan again, it is going
8:42
to cross-reference it against my options watch list over on the left-hand side. Now at the moment
8:48
it doesn't actually look like we have any results. It currently says no matching symbols, but let's
8:53
I wanted to be alerted if that ever changed. So now to do that we do need to first save this scanner
8:58
so we'll come up here to the top right hand corner and click on the three little lines
9:02
We'll then come down below and hit save scan query. We'll just need to give it a name and in my case
9:07
I just going to name it SMA crossover just to keep it simple and then come down here and hit save And now that that scan has been saved if I wanted to access that scan and always keep an eye on those stocks to see
9:21
what actually meets my criteria right now I could come over here to the far left hand side and add
9:26
a brand new watch list specifically for that scan. So right here we'll hit this little plus sign to
9:32
add a new gadget. We'll then specify that we want to add a watch list. I can then come up to the name
9:38
of the watch list which is currently indices go ahead and click on that and then in the menu that
9:42
appears up at the top we simply need to find my personal section where all of my watch lists are
9:47
stored and then click on the one that we just made sma crossover so now looking back down below in
9:54
that watch list anytime a company now meets my criteria it would pop in this list automatically
9:59
so anytime one of those companies in the options watch list that i've already made have a recent
10:04
an SMA crossover, it'll appear in here automatically. But what I want to do next is actually create an
10:09
alert off that since I don't want to be watching this all day long. So in order to do that, we will
10:14
need to come up here to the name of the watch list once again. So right here, SMA crossover
10:19
We'll then simply find in the list up here at the top where it says alert when scan results change
10:24
and go ahead and click on that. That'll then create an alert menu where we can then specify
10:29
when we want to be sent an alert. In this case, it's saying whenever a symbol is added to this
10:34
watch list, send me a text message. If you wanted to click on that menu, you could change it to a
10:39
symbol is removed or a symbol is added or removed if you wanted to get notified for either condition
10:44
But in my case, I'm just going to say if a symbol is added. So now to save that, we'll simply come
10:49
down here and hit create in the lower right hand corner. And now to double check that that alert
10:54
is working, I could come up here to my market watch tab, then select the alerts tab. Right here
11:00
you can see that brand new scan alert we just created. And right here, it's called the SMA crossover alert
11:05
and it's gonna trigger anytime a symbol is added to our scanner. To double check real quick how we'll actually be notified
11:11
if we come up here to the setup menu in the upper right-hand corner, then open up the application settings window
11:18
here within the notifications tab, and then down below where it says alert is triggered
11:22
if we click on that, you can see I'm gonna be notified by sound, so it's basically gonna ring on my platform
11:28
but also I'll be sent a push notification since I have thinkorswim downloaded on my phone
11:33
You could also come up here and add a phone number or add an email address and then check
11:37
mark it down here that you want to get an email or a text but after you get it set up you would
11:42
just hit apply settings in the lower right and now anytime there is an SMA crossover on any of
11:47
these stocks on the left I will get a push notification on my phone as a buy or sell alert
11:52
So hopefully that helps. Hopefully after all that you feel a lot more comfortable with how to create
11:57
an advanced alert within Thinkorswim and specifically an SMA alert. If you do still
12:02
have questions or recommendations for another study alert you would like me to create
12:06
just let me know down below. In the meantime, if you were looking to learn more, YouTube seems to
12:11
think you'll find this next video helpful as well, so go ahead and check that one out. But that's it
12:15
for now. Have a great rest of your week, everyone, and I'll catch you on the next video
#Business & Industrial
#Finance
#Finance
#Investing
#Stocks & Bonds