
Bollinger Bands Explained | How to Trade Using Bollinger Bands
Dec 16, 2022

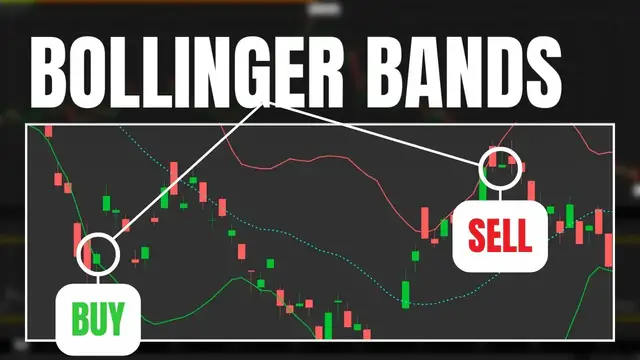
Bollinger bands are one of the most popular technical indicators available today. They can be used to discover areas where a stock is overbought or oversold or as a way to measure volatility.
Throughout this video we’ll discuss how the Bollinger Bands are calculated, how they can be used to find buy and sell signals, and how we use them to uncover volatility levels. We’ll cover the ins and outs of the Bollinger bands to ensure you understand exactly what you’re looking at.
Timestamps
0:00 Intro
0:23 Bollinger Bands Calculation
1:32 Charting Bollinger Bands
2:38 Practical Examples
5:27 Bollinger Bands Crossover Scan
8:54 Outro
➤ Open a tastyworks account: https://start.tastyworks.com/#/login?referralCode=PKSKCFVD2J
➤ Start Investing with M1 Finance: https://m1finance.8bxp97.net/151KXm
Disclaimer: Some of these links go to one of my websites and some are affiliate links where I'll earn a small commission if you make a purchase at no additional cost to you.
Show More Show Less #Finance
#Investing
#Stocks & Bonds