Up next in 10

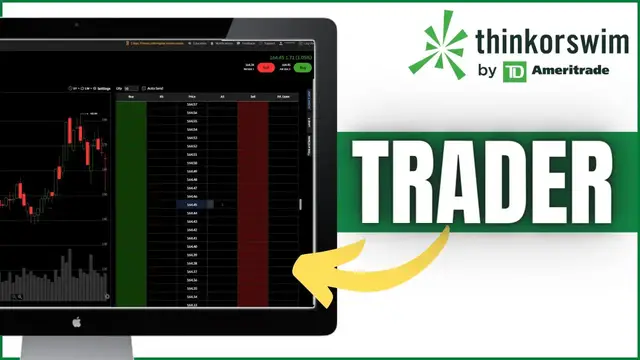
Active Trader Tutorial for ThinkorSwim Web | Fastest Way to Trade Stock on TOS Web
Dec 17, 2022

In today's video we'll learn how to use the Active Trader tool on the ThinkorSwim web platform.
This was only just added to the web version of thinkorswim a couple days ago, so they definitely have some kinks to work out before its perfect. I’m still in favor of the desktop version overall, but the web version of TOS is starting to grow on me.
For those of you unfamiliar with the Active trader tool, it’s the fastest way to trade on thinkorswim. So its definitely a great addition to the online version. The one were going over today might look a bit different, but for the most part, you’ll use it the same way as on the desktop .
➤ Open a tastyworks account: https://start.tastyworks.com/#/login?referralCode=PKSKCFVD2J
➤ Start Investing with M1 Finance: https://m1finance.8bxp97.net/151KXm
Disclaimer: Some of these links go to one of my websites and some are affiliate links where I'll earn a small commission if you make a purchase at no additional cost to you.
Show More Show Less View Video Transcript
0:00
Hey everyone, welcome back to the Thinkerswim tutorial series
0:03
In today's video, we'll be hopping into the Thinkerswum web platform and going over the Active Trader tool
0:08
Now, this feature was only just added to the web version of Thinkerswim a couple days ago
0:12
so they definitely have some kinks to work out before it's perfect. But overall, I'm just glad to see that they're continuing to add features to Toss Web
0:19
That's definitely a good sign for its future. I am still in favor of the desktop version
0:24
There's just way more customization, way more tools on there, but the Toss Web version is definitely starting to grow on
0:29
me. Now, for those of you completely unfamiliar with the Active Trader tool, it's probably the
0:34
fastest way to trade on Thinker Swim, so it's definitely a great addition to the online version
0:39
The one that we're going to be looking at today might look a little bit different than what you're used to, but for the most part, you're going to use it the exact same way. Now
0:46
jumping right into the Toss Web platform, you can see them currently in a paper money account
0:51
and you can see all of the positions I have in this account. But in order to actually access
0:55
the Active Trader tool, there is two different ways to do it. First off is by coming up here to the
0:59
find a symbol box and typing in a symbol that we want to trade. In our case, let's say we want to take a look at SOFI
1:05
So I'm going to go ahead and type an SOFI up there and hit enter on the keyboard. From there, you can see a SOFI stock profile page immediately opens up
1:13
We can see what SOFI last traded for. If we look down a little bit, we can see a SOFI option chain
1:18
And we can also see what my current position is on SOFI. If we were to look down a little bit further, we can also see a nice big chart of SOFI
1:26
And in order to actually access the active trader tool, we just need to look at a on the far right-hand side and select the Active Trader tab
1:33
As soon as we click on that tool, you will see it expand over to the left-hand side
1:37
and it does look a lot like the desktop version, but we're going to get into that in just a minute
1:42
Now the second way to access this tab is actually by coming over here to the far left side and clicking on the charts tab Once we click on that it should look pretty much identical except now we got an expanded view of SO chart as well as the Active Trader tool
1:55
Now, the main difference between this one and the last one is obviously that this one gives you an expanded view
2:00
but also the fact that I can't see my current positions from this page. That's one of the big things that I really hope they change
2:06
because as of right now, I'm not going to be using the Active Trader page on here
2:11
I'm going to go back to the trade page, which is a lot smaller, but I can actually see my current positions
2:16
The other thing they don't currently have on here, which I do hope they add is a buy market and sell market button
2:21
as well as a flattened button. Those would be nice additions that they already have on the desktop version
2:25
that I hope they move over here as well. Now, jumping right into it
2:29
if we actually scroll down just a little bit and take a peek at our Active Trader tab
2:33
the first button you'll notice up here is the quantity button, and as of right now it says 10
2:37
So that means any time we hit the buy or sell button, we're buying 10 shares at a time
2:41
If you wanted to change that, you would simply highlight it and type in the quantity of shares you do want to trade
2:46
In my case, let's say I wanted to bump that up to 25 at a time, so we'll go ahead and type in 25
2:51
The other button up there at the top that says auto send, that is simply a way to get rid of order confirmations
2:57
As of right now, if I were to come down here and click on one of these prices at the moment
3:01
a order confirmation will come up asking me, are you sure you want to place this trade
3:05
For example, if I come down here and click on the price next to 1158, let's say, a little order confirmation box pops up
3:12
asking me if I'm sure, and if I am, I would have to hit review and send again
3:17
If I were to delete this and actually flip on that auto send button, if I were to click on these prices, the order ticket is instantly submitted
3:24
So you can see there, I instantly bought 25 shares of SOFi at that price, 1158
3:30
If I were to come over here to the red column and actually click on one of these prices like let say 1162 that order ticket is instantly submitted at 1162 If I wanted to cancel that order I would simply click the X button And from there you can see that order has been immediately canceled
3:45
Now, breaking this thing down a little bit more, because I know I kind of just jump right into it
3:49
if we look down the center column here, the price column, that is actually the current price for SoFi
3:55
The current price is going to be highlighted in blue. Now, if you look to the left of each one of those columns, you're also going to notice that
4:00
there are share quantities in here. Right now it says 40 here and 20 over here on the right hand side
4:05
Those are actually the open orders, open orders to buy and sell this stock
4:09
If you look at the bid size column, those are open orders to buy the stock. And if you look at the ass size column, those are open orders to sell the stock
4:16
So basically your level two data. The other thing you need to keep in mind is that those are in hundreds of shares
4:21
So if you see the number two there, that's 200 shares. If you see the number 62, that's 6,200 shares
4:27
Now, in order to actually place orders to buy or sell the stock, you simply need to either click on the green column to buy or the red column to sell
4:34
So once again, if I wanted to come down and only buy, let's say these 25 shares of SOFi
4:39
if it drops down to 1140, I would find the 1140 price right here in the center
4:44
come over here to the left-hand side and click on this price. As soon as I do, you can see that that order ticket does get submitted
4:50
and you can also see it reflected on the chart on the left-hand side. If I wanted to, let's say, adjust that I was actually willing to pay a little bit more for it
4:57
I could either come down here to the bottom and drag it. it up, let's say, to 1143, or I could also do that on the chart on the left-hand side by
5:05
clicking on it and dragging it up. Now, since I don't actually want to do that, I'm going to
5:10
go ahead and exit out of it, since I don't want to place this trade. But there we go. That's how
5:14
we're going to place in order to buy the stock. Now, if you wanted to sell shares of stock
5:18
like we talked about before, you're going to come over here to the right-hand side. So let's say I
5:22
wanted to sell my 25 shares of SO if it ever went up to 1172 So finding the price right here in the center I going to come over here to the right hand side and click in the little red box here As soon as I click on it you can see the order ticket does get submitted and I can see it over here on my chart
5:36
as well on the left hand side. Now, the last thing you might notice in this active trader tool is
5:42
the P&L open on the right hand side. That's actually reflecting if the stock were to go up or down
5:46
and comparing it against your current position, how much money would you make or lose if it went up
5:51
or down to that price. So as of right now with my 125 shares of SoFi at the price I own it for
5:57
if Sofi were to go up to, let's say, 1191, I would be up $23.25 on this trade
6:03
If so if I were to go down and let's say it went down to 1159, well, hey, I'm out $16.75
6:10
Now, I do also want to mention that where you put your mouse here, where you put your cursor or click
6:15
it's going to change the order type that actually gets submitted. So when you're selling and you go above the current price
6:20
you'll notice that it's automatically a limit order. If I were to scroll down below the current price
6:25
you can see that it defaults to a stop order. So the system kind of auto recognizes
6:29
what type of order you should be using. That's exactly the same for the buy side as well
6:34
So if you go below the current price on the buy side, it's going to be a limit order. And if you go above the current price
6:39
it's going to change to a stop order. But that's really it. That's everything you need to know for the Active Trader tab
6:44
on the TOS web platform. Just keep in mind that you need to come over here and click on Active Trader to see it
6:49
I still recommend you, use the trade page so you can actually see your positions up here because if you come over to charts
6:55
you can no longer see how many how many shares you have of the stock you're trading now I hope that
6:59
helped I definitely recommend that you practice a bit in paper money before you jump into it in your
7:04
real account but as you've already seen it is the fastest way to trade in this platform
7:08
if you guys have any questions for me please leave them down below but otherwise I hope you
7:12
guys have a great rest of your week and I'll catch you guys on the next video
#Finance
#Finance
#Investing
#Stocks & Bonds