Up next in 10

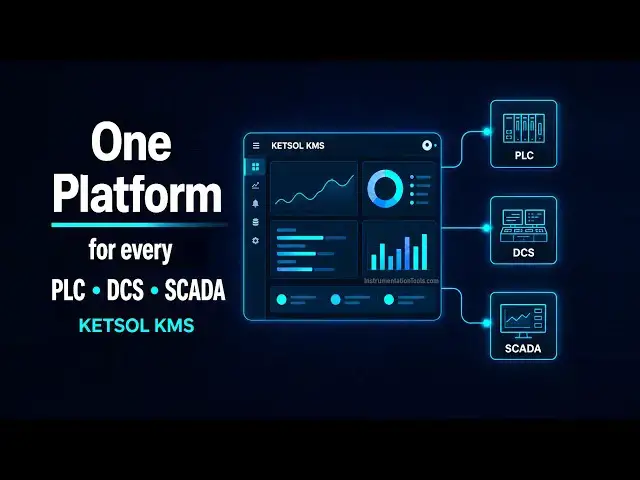
Discover KETSOL KMS, a unified industrial platform that connects PLC, DCS and SCADA systems, bringing plant data together for real-time monitoring, analytics and smarter decisions.
Website: https://ketsol.ai/kms
** Video Topics **
0:00 KETSOL
0:30 PLC and Controllers
1:09 From PLC tag to plant decision
2:52 Connect every PLC, DCS and SCADA on a plant
5:48 Kepware vs KMS platform
6:43 Tank Farm Management
7:20 Energy Meters
8:22 Industrial Communication Protocols
9:52 KETSOL Manufacturing Suite
10:15 Modbus Connection
10:54 Energy Meters Configuration
12:15 Live Readings
14:13 Modbus Communication Status
14:50 Import and Export Configurations
16:08 Historian
16:54 Conclusion
#plc #scada #dcs #ketsol #kms
Tags:
KETSOL KMS, KMS, Ketsol Manufacturing Suite, manufacturing operating system, industrial automation, PLC, DCS, SCADA, PLC integration, DCS integration, SCADA integration, industrial data platform, manufacturing data, industrial IoT, IIoT, plant monitoring, real time monitoring, industrial analytics, manufacturing intelligence, PLC data, SCADA data, DCS data, industrial data integration, smart manufacturing, factory automation, plant intelligence, industrial AI, automation platform, process automation, digital manufacturing, Industry 4.0
Show More Show Less View Video Transcript
0:00
Hello everyone. Myself Bharadwaj. In
0:03
this video, I will show you one
0:06
interesting software which is very
0:08
useful in our day-to-day industrial
0:11
applications.
0:13
This software, it is a software gateway.
0:16
It accepts inputs from different systems
0:19
like PLC, DCS, SCADA and provides
0:24
dashboards, historian, trends, live
0:28
actions.
0:30
I will show you the different types of
0:32
inputs it accepts like Modbus TCP,
0:35
Modbus RTU, Siemens S7 communication,
0:39
Allen Bradley Control Logix, MicroLogix,
0:42
Mitsubishi, TwinCAT, etc. It also
0:47
accepts inputs from OPC, OPC UA, DA,
0:52
HDA, and A&E.
0:55
It also accepts BACnet IP or SNMP, MQTT.
1:01
MQTT is very helpful in IoT or IIoT
1:04
applications.
1:06
And I will show you one simple example.
1:09
You see here
1:11
and on the left side,
1:14
we have site one, site two, site three.
1:18
Site means one industrial plant at one
1:21
location.
1:22
We have for example in this case, we
1:24
have Siemens PLC. We are taking the
1:26
Siemens PLC data and the connected to
1:29
the software gateway. Software gateway
1:31
is nothing but a simple software
1:33
application which you have to install in
1:37
your engineering workstation or a
1:39
separate dedicated server.
1:41
You can take data from Siemens PLC
1:43
directly and are from the SCADA at one
1:47
location. Let's say we have three
1:49
industries.
1:50
This is my first industry. In the second
1:52
plant, we have Yokogawa DCS and one
1:56
Allen Bradley PLC. And the third site we
1:59
are taking one video as a feed. Okay,
2:02
whatever the type of input of the
2:05
control system, you can connect
2:08
to this gateway and then finally you can
2:11
connect to a cloud and then you will get
2:15
dashboards. You can get live data
2:18
viewing. You can have historian. You can
2:21
have trends. Okay, and also you can
2:25
trigger events like for example, you can
2:29
set daily reports, shift wise reports,
2:32
or let's say the plant is tripped and at
2:36
that time you can configure and you will
2:39
receive the reports in your email or
2:44
other networks like Telegram etc.
2:48
Because we have web hooks available.
2:51
And what this software will do is it
2:54
provides connections. I mean, it
2:57
it takes these inputs, OPC UA, Modbus,
3:01
S7 communication, Ethernet IP, MQTT,
3:05
native drivers for different brands,
3:08
Schneider, Rockwell, ABB, Yokogawa, etc.
3:12
You can connect all these systems data
3:16
to this software. Okay.
3:20
What you can do, you can store the data
3:24
and then provide trends, historians,
3:27
dashboards, triggers like that. You can
3:31
do the visualization and remember there
3:34
is no need for any coding. It is simple
3:37
drag and drop type features available.
3:41
Anyone can do the
3:43
simple
3:44
drag and drop and can achieve the
3:46
required requirement. No need for any
3:49
complex logics or coding. there is no
3:53
need.
3:54
And you can do the app. You can provide
3:58
conditions. You can provide rules
4:00
like triggers. For example, my plant is
4:04
down.
4:05
Okay, there is some trip. There is no
4:07
production. And then you can provide
4:10
triggers such that, let's say in one
4:13
example, I can configure email that in
4:17
your email you will receive the data
4:20
what is the problem, why it is tripped.
4:23
Okay, like these things. You can
4:25
configure this as per your requirement.
4:28
And also you can connect this to a local
4:30
LLM
4:32
or you can connect to a internet. It is
4:35
ask. I mean, for example, you have the
4:38
data and you can ask the AI or you can
4:41
ask the LLM layer that what is the
4:44
problem, why my PLC got tripped, why the
4:47
industrial production is down. And then
4:51
it is already having the data analytics
4:54
and it will give you the correct
4:57
reason for the problem.
5:01
And you can configure the reports, batch
5:03
report
5:05
or a day report, shift-wise reports,
5:08
like that.
5:09
It also supports 21 CFR part 11.
5:13
Alert.
5:14
You can configure audio alarms, Telegram
5:18
updates,
5:19
social uh have any
5:22
specific groups, you can
5:24
because webhooks are available, you can
5:26
use directly or with third-party
5:28
scripts, apps, you can configure to
5:32
different applications. You will receive
5:34
the alerts instantly.
5:37
Okay.
5:39
As this is a edge gateway and the our
5:41
cloud, it is easy to scale as per your
5:44
requirement.
5:47
So I will show you one example.
5:49
See,
5:50
here this is the before and this is
5:52
after. What is before? We have three
5:54
plants available, three industries
5:56
available at the different locations.
5:59
Previously, they are using Kepware.
6:01
And from for plant one, we have one
6:04
dashboard. Dashboard is nothing but you
6:06
can simply say it is a graphic where you
6:08
can view
6:09
see all the data of the plant like a
6:12
overview all important tags critical
6:15
tags which you require to monitor.
6:18
Okay. So, in this application, they have
6:20
different three plants and each plant
6:23
have one dedicated Kepware
6:25
uh server with license, obviously. And
6:28
we have different dashboards.
6:30
But, the KMS, it is a software, right?
6:33
It is a software gateway. It connects to
6:35
three plant plants, three industries,
6:38
and provides one dashboard.
6:41
Okay. This is one of the application and
6:43
this is the second application. This is
6:46
tank farm. We have different uh sites,
6:49
different industrial areas where we have
6:52
tank gauges are there. So,
6:55
site one, site two, site three, site
6:57
four. All the sites up to 12 sites in
6:59
this application. All the sites data is
7:02
connected to one KMS central aggregator.
7:05
And then you will have the live
7:06
dashboard reports. You can configure the
7:09
daily email. What is my report? What is
7:12
the uh production? What is the status,
7:16
right? All the things you will receive
7:18
in the email.
7:20
Similarly, this is one more application.
7:22
This is energy meters. We have around
7:26
420 meters here, okay?
7:28
You can say client A, client B, client
7:30
C, client D.
7:32
In client A, we have 120 meters. Client
7:35
B, 95 meters.
7:37
It is simply client A, nothing but one
7:38
location, second location, third
7:40
location, okay? Like that, we have
7:43
different uh energy meters.
7:46
And in this application, we are using
7:48
Modbus to get the data from the energy
7:52
meters. And all these energy meters are
7:55
connected to the KMS.
7:57
And the KMS, this is a software, it
8:00
provides
8:01
the centralized dashboard with live
8:04
updates, real-time alerts, and energy
8:08
reports, daily, weekly, monthly, bills,
8:12
everything.
8:13
Okay?
8:14
So, this is one of the application.
8:16
For Modbus, I'll show you. Before that,
8:18
I'll show you one simple animation. If
8:21
you see here,
8:23
on the left side, we have different
8:25
communications. These are the input to
8:27
the KMS. The KMS, the software, accept
8:30
these inputs.
8:32
So, you can use any of the
8:35
communication protocol, like Modbus TCP
8:38
IP, RTU, Siemens, going to type in
8:40
Mitsubishi, SQL, MQTT, BACnet, camera,
8:45
OPC, different types of OPC. You can
8:47
also give the data from the Excel sheet.
8:50
IEC 61850, DNP3, like that. So, it takes
8:55
all the data.
8:57
Okay? And then provides one centralized
9:00
dashboard with historian. It provides
9:02
analytics, events, alarms,
9:05
notifications, trends, data archive.
9:09
Also, this all the data can be exported
9:13
in different formats, like PDF, Excel
9:15
sheet, notifications. And also, you can
9:18
distribute this data as and when
9:20
required or as per our requirement via
9:24
email, Telegram, Teams, etc. Remember,
9:27
we have We can also have the web hooks,
9:30
nothing but
9:31
we can trigger some third-party
9:33
application if required. In your plant,
9:35
let's say you are using some third-party
9:37
application, third-party tool, you want
9:39
to send the data or the trigger from
9:41
this platform to that platform, it is
9:43
easy to do that.
9:45
So, let's go back to the energy meters
9:48
and see how to use this Modbus with KMS.
9:52
Now, we have to open the website or the
9:54
link which you configured it is
9:56
and we have different types of
9:57
communications protocols available,
10:00
right? These are the communication
10:01
protocols, right? In this application,
10:04
we need Modbus. So, select Modbus TCP.
10:09
And you need to create a new connection
10:11
because this is the first time I'm
10:12
configuring a energy meters application.
10:15
So, new connection
10:17
and then you have to connect the
10:19
uh sorry, you have to provide the name
10:21
and the IP address and the port for this
10:24
Modbus. Let's say I will enter energy
10:27
meters. This is my application.
10:29
Okay, EMS uh meters. For example, this
10:32
is this is my energy meters. The scan
10:35
time is 1,000 ms and I will enter the IP
10:37
address for the Modbus TCP connection
10:40
and the port and click test connection.
10:42
It is successful. Okay.
10:44
And then save.
10:46
It is saved.
10:48
At the bottom, if you see, this is my
10:49
new one, right? And it is offline. You
10:52
click here and it is available. Click
10:54
edit and now we have to configure the
10:57
required tags.
10:58
I will add one group. Okay.
11:01
Group is nothing but uh client A, client
11:04
B, client C like that or different
11:05
areas, different locations. Okay. Now, I
11:09
will enter the group name. Let's say
11:10
group one.
11:12
Okay. For testing purpose, demo purpose,
11:14
I'm just entering group one. Modbus ID
11:16
you have to enter and then add.
11:20
In this group, I will configure the
11:22
required energy meters.
11:24
Okay.
11:26
This is like one group, one area and
11:28
here I will configure the energy meters.
11:30
Add. Here I'm using the holding
11:33
register, so I will select FC3, and I
11:36
will enter my address,
11:38
and then the required quantity. I want
11:40
to configure two parameters, so four
11:42
I've entered because it is a 32-bit.
11:45
Okay?
11:47
Now, I will enter the
11:49
tags in this block.
11:51
Okay? Nothing but a group. Voltage, it
11:53
is a floating 32-bit,
11:55
and current, it is also a float 32-bit.
12:00
I had to select the respective
12:02
data type, enter the tag name. Okay?
12:06
And then if you see click the preview
12:07
button, that as the test connection is
12:09
successful, if the data is available,
12:12
the readings will come here. Let's see.
12:16
Yes. See, the readings are updated. The
12:19
voltage is 231, the current is 20 A.
12:23
Okay? Like that, one energy meter is
12:25
configured. In some applications, you
12:28
have to write back. That means you have
12:31
to send the data from the software KMS,
12:34
or any third-party or cloud software to
12:37
the PLC, to the energy meter, to the DCS
12:40
system, then you can use the write back
12:42
option. In this case, it is not
12:43
required. We are only reading the data.
12:46
Right? If required, we have to enable
12:48
it.
12:49
Now, there is no need to enable. Now,
12:52
update.
12:54
Now, the data is updated. Now again, I
12:57
will add few more.
12:58
Okay? Again, edit.
13:02
And then I will add second group. This
13:04
is second location, group two.
13:07
Okay? Modbus ID two. Modbus ID must be
13:10
different. Remember.
13:13
And then again, I will add voltage and
13:14
current.
13:16
Okay? This is for second group, second
13:18
location.
13:20
In group two, I'll open and add
13:23
register. Again, I will use FC3. I will
13:25
use start address, and then quantity
13:27
four, because I need to add only two
13:29
parameters. Each one is 32-bit.
13:33
Right?
13:34
So, again, voltage or current. Okay,
13:36
current and float 32. Voltage
13:40
float 32.
13:42
Test.
13:43
See, this is a different Modbus, and you
13:46
can see the value which is different.
13:49
Uh volt
13:51
Okay, for testing purpose, it is just
13:52
entered like that. Uh no need to worry
13:55
about it.
13:56
Okay, update.
13:59
Like this, we can do. We can also use
14:02
import and export using Excel sheet.
14:04
Let's suppose we have so many tags, then
14:07
you can use the
14:08
uh Excel file to do the import or export
14:11
of the configurations. Now, I will do
14:13
one thing. I will export it.
14:16
Okay, if you see here, this is a uh tag
14:21
for the group.
14:22
Okay, this is for group one. It shows
14:25
that if you open this tag, and you can
14:28
see the group is healthy or not healthy.
14:30
Communication is healthy or not healthy.
14:33
So, but to do that, we can use this tag.
14:37
Okay. System.tag.group1.communication.
14:40
Like that for group two.
14:42
For all the groups, we have one uh
14:44
individual respective communication bit.
14:47
You can see the status of the
14:48
communication.
14:50
Right?
14:51
Now, I will export it. These are the
14:53
configurations exported in Excel file.
14:56
You can see the data group one, group
14:57
two we created, and voltage and current
15:00
is there. Now, what I will do, I will
15:02
add group three using Excel file. Okay,
15:05
I'll do the copy and paste, and I will
15:07
rename from group one two to group
15:10
three.
15:11
Okay, this is my third group I'm adding
15:13
here via Excel file.
15:16
Device ID three.
15:18
Okay.
15:19
Address I'm changing.
15:22
Okay?
15:24
Again, tag address also.
15:27
It is updated.
15:30
Everything same.
15:32
I'm updating correctly the voltage
15:34
current sequence. And save. Now, I will
15:37
import this Excel file into the
15:40
system.
15:41
Now, when you import, it will
15:43
automatically
15:44
create the configurations.
15:47
See, import is done. Now, group three is
15:49
created. Update. Again, open. You can
15:52
see the status. You can read the data.
15:55
See?
15:56
Group two now.
15:59
Now, group three.
16:04
Okay?
16:06
So, like this, we can configure
16:10
different equipment. This application
16:12
only shown is
16:13
energy meters. You can connect a PLC,
16:16
DCS. You can use any communication
16:19
protocol which is available in your
16:23
system. In this case, for simple
16:25
testing, I shown you the Modbus TCP
16:29
connection, right?
16:31
Now, let us see the status. And I will
16:33
enter EMS our own meter. And you can see
16:37
the
16:38
different tags, its values, quality,
16:41
status, and the group tag name. Okay?
16:45
And its status value true, quality is
16:48
good. That means quality is good. That
16:50
means communication is healthy.
16:52
Everything is perfect. So, like this,
16:55
you can easily do the configurations for
16:58
different systems with this KMS. And we
17:01
can provide live dashboards, real-time
17:04
alerts, reports.
17:06
And remember, we can interface these
17:09
things to the
17:11
third-party tools as required.
17:15
So, I will show you
17:17
some more
17:19
detailed application uses for this
17:21
software in the coming videos.
17:24
Meanwhile, you can
17:28
explore this software.
17:31
Okay.
17:34
Uh because the trial version is
17:35
available,
17:37
go to get sold.ai website and download
17:41
the free trial and test this software
17:45
with your systems.
17:47
This is very useful software and
17:49
provides many benefits. Hope you will
17:51
try this.
17:53
You have any questions,
17:55
comment now.
17:57
Thank you. I will meet you in the next
18:00
video.
Science