0:00
Hey guys, and this is Taleb from Asa Kix
0:02
And I just wanted to make this quick videos to show you a couple of things about the resale or resell predictions that I see sometimes people talking about
0:12
A lot of times people do this resell predictions. They go and look at what Star Kex is saying
0:19
The average price is, they may not even go on eBay. They may just stick with what they see on Star Kex, which is fine by me
0:27
Do that all day. But you got to give out solid and well thought of information
0:36
Because sometimes there are flaws with what Starkex is saying on the main website
0:41
And I will show you what I'm talking about. I'm just going to give you a couple of examples on my board here so you can understand what I'm saying
0:47
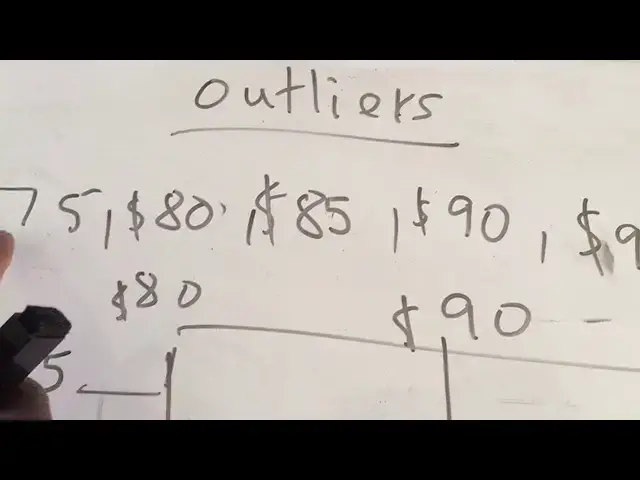
All right. So let's explain this chart here and I'll tell you exactly what it means
0:52
Let's say I'm on Starkex or eBay or whatever and I collect my data, right
0:56
I have $75. That's a shoe that I'm looking at. That's worth like $75 on a certain size, $80, $85, $90, $95, $90, $10, and then $300
1:08
Right? What I'll show you below is called a box flood, and I'll explain what it means
1:12
Now, if you find your average based on these values here, 1, 2, 3, 4, 5, 6, 7
1:18
you will give you 119 and some change. Now, on stock X, you will see average value 119
1:25
So you're going to go based on that and make your resell prediction. But this is not reality and I'm going to explain why I'm saying that
1:33
Now, this box plot here shows you like the five number summary
1:37
This is the minimum value the shoot went for The highest the shoot went for was And you have your quartile 1 and quartile like 3 It and the medium value is
1:50
Okay? Now here's the thing. If you base your average sale value based on this $119, you're making a colossal mistake
1:57
because what you have is an outlier and $300 is very irregular
2:03
Because if you look at your data, you have $75, $80, $195
2:08
and $300. So when you run your average, you take the $300 so you put it in, it's going to screw
2:14
up your numbers. It's going to mess it up. So you have to have your cutoff values
2:19
These are your cutoff values here. Anything below 50 is considered an outlier, and anything above $130 will be considered
2:25
an outlier. That means that $300 should not be taken into consideration
2:30
You should be out of that. So your average should be found based on $75, $85, $85, $85, $90, $95, $90, $95, $300
2:38
and one thing. So when you own your computer and you give people these
2:43
research predictions, you base your research prediction based on this 119, you're
2:47
giving up bad information because you have an outlier which you haven't calculated
2:51
and now that's causing problems. You make people lose money. You got to be really
2:56
really smart about what you're doing. You got to take your time and really study your
3:00
data. You can't just look at what Stark X is saying and then make some
3:03
suggestion based on what you see on StarCax. You really have to look at the data
3:07
in completeness. You have to look at every single entry and make your prediction based on what you see and what you observe
3:15
You have to be careful, guys. All right, that's what I wanted to clarify. There are a lot more flaws that I see, but I'm not going to talk about it today
3:21
I just wanted to mention this. All right? Thanks for watching. This is Tai for Master Kix and stay tuned for my stuff