0:02
Technical analysis for beginners. In
0:05
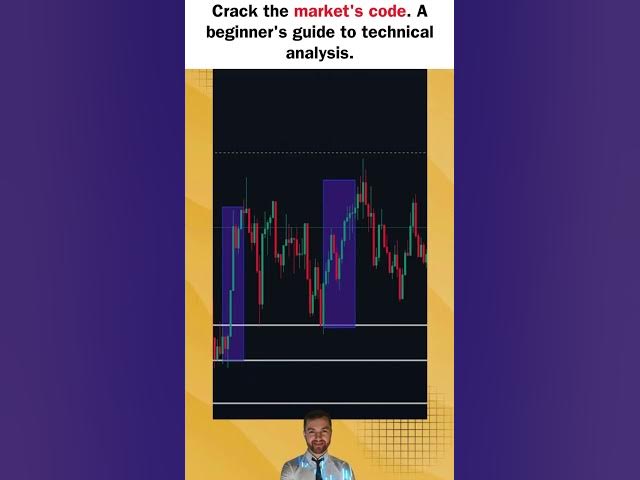
this video, we are going to be analyzing
0:08
GBP [music] JPY on the 1 minute and we
0:10
are going to be using resistance and
0:13
support zones, [music]
0:14
rallies, pullbacks, stop loss, and take
0:18
profit levels. So, if you come on the
0:22
chart, we're going to identify support.
0:25
Support is a zone where buyers are
0:28
coming from. So [music] after the market
0:31
forming this support zone they're
0:33
getting this rally to the upside the
0:36
rally [music] is forming a higher high
0:40
of the market giving us a higher high we
0:42
having a pullback after [music] this
0:44
pullback market is forming another
0:48
support zones above the previous support
0:51
and uh is also creating a new rally
0:56
to the upside creating another higher
1:00
high. Notice [music] how price is
1:03
pulling back. When it is pulling back,
1:06
it is still [music] respecting the
1:07
previous support zones. What does that
1:10
indicate? Indicates that the market
1:12
[music] is pushing upwards. So, we're
1:15
having this support zone being created
1:19
here above this one. And it is still
1:22
also giving us another rally to the
1:25
upside creating another higher high
1:29
also giving us a level of resistance.
1:33
Here's the most important thing the
1:35
pullbacks and the entries. So after
1:38
seeing the market is [music] respecting
1:40
u the support zones the previous support
1:44
zones. So we also after after this
1:46
pullback here we are expecting the
1:49
market to push upwards looking for
1:52
previous resistance zones. So if we are
1:57
to highlight our pullback out here we
2:00
having this pullback here.
2:03
So the price is pulling back in this
2:07
here. That is giving us our pullback.
2:11
And you're seeing that the price is
2:13
breaking out from this channel at this
2:16
level here. And then is coming back
2:21
on the on the breakout. And look at
2:25
[music] look at how it is reacting at
2:28
this level here. is giving us a very big
2:33
[music] long momentum candle of buyers
2:36
and this candle is also engulfing. What
2:40
does that mean? This indicates that the
2:44
buyers already push the market further
2:48
to the upside. [music]
2:49
So we shall call left here and we see
2:53
the previous resistance zones. These
2:56
ones [music] are going to be our levels
2:58
of the graphics. That's where we're
2:59
going to be taking profits from. So on
3:02
the closure of this candle, we are going
3:07
a buy. The stop loss is going to be
3:10
below support zone that was created at
3:12
that level. Then we aim [music] for that
3:17
take profit zone. So if you find this
3:21
information valuable, don't forget to
3:23
subscribe and uh also like all all of
3:28
these concepts are in our BYBT [music]
3:31
strategy ebook. The links are in the
3:37
So that's our video for today.
3:41
See you in the next one.