Up next in 10

Get the full source code of application here:
https://gist.github.com/gauti123456/016d4aa8d1694e6fda7d6334c64f7a31
Show More Show Less View Video Transcript
0:00
uh hello guys welcome to this video so
0:02
in this video I will show you a react CH
0:05
uh chart example how to plot a basic
0:09
line chart using these x coordinate y
0:11
coordinate simple data we have simply
0:15
plotting this chart and we are using
0:17
this package which is chart.js which is
0:19
a very famous uh charting library for
0:22
JavaScript you can even use it inside
0:24
react CH with this package which is
0:28
react Das chart
0:30
js-2 and we are also using chartjs as
0:33
well so this is a simple line chart if
0:37
you see and we are using these x
0:40
coordinate y coordinate and we have two
0:43
aises so first of all uh you need to
0:46
install these two packages so just write
0:48
chartjs inside npmjs.com and the very
0:53
first package which comes this is a
0:54
actual Library this is a command I've
0:57
already installed it almost 4 million
1:00
weekly
1:02
downloads so just make sure that you
1:04
install this and specifically for react
1:06
shars we do have this module react chart
1:11
chs-2 we also need this module as
1:14
well so it's specifically react
1:17
component for chartjs so almost 1
1:20
million weekly downloads are there so we
1:23
are actually using these two modules so
1:25
I will just show you a very simple
1:28
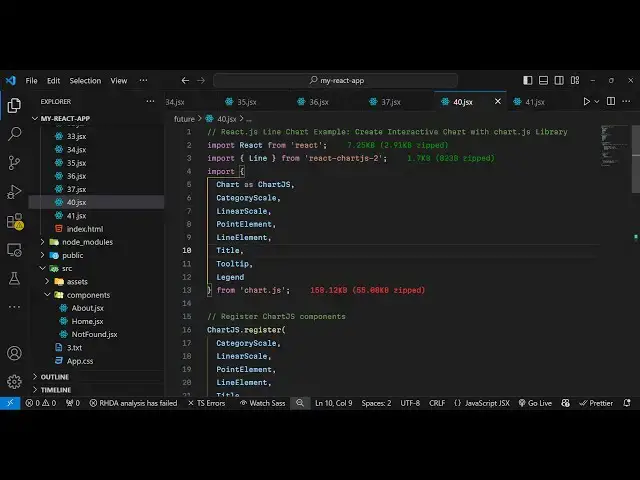
example so first of of all I will
1:32
import the line
1:34
component from react chart GS2 this is
1:38
useful for making the line chart and
1:41
then we will be importing all the basic
1:43
stuff from The Base chartjs Library so
1:46
all these things will be imported if you
1:49
see the base chart JS
1:52
Library so all these
1:54
things which is
1:57
necessary so now we just need to
1:59
register these components one by one so
2:01
we will basically use this register
2:04
function inside Char GS and we will
2:07
basically P pass all these things one by
2:12
one which we
2:15
imported Point element then we need line
2:20
element then we need the title tool
2:25
tip and Legend So these are all the
2:28
components which are part of the
2:31
chartjs Library so we are just
2:33
registering it and now our inside our
2:37
component we need some State we need
2:39
some data to plot so this data object
2:42
will actually contain two properties
2:45
first will be the
2:46
label so this label will be having the
2:50
uh month names from January to
2:54
July and inside our data sets we
2:58
will have
3:00
this much of data you can take any data
3:02
of your choice I'm just taking this
3:06
uh object of a
3:10
particular salesman so we have the sales
3:14
data we are customizing and customize
3:17
everything background color water color
3:19
we given this rgba color you can
3:22
customize everything and then here you
3:25
need to provide the
3:27
options object
3:33
I think uh this needs
3:37
to okay this needs this is actually the
3:40
own object outside this alongside with
3:44
the data we do need to provide the
3:46
options as well which contain a property
3:49
for responsive so I will set it to true
3:52
if you have some additional plugins you
3:54
can set this using this so we have the
3:57
title plugin here we can change the
3:59
display information display the title
4:02
and just give it a text of monthly sales
4:07
data so here you can provide a
4:09
customized title to your chart so I'm
4:12
just displaying monthly sales data so
4:14
I'm just doing that now in the jsx it's
4:17
very easy now to display this chart so
4:20
inside the diff we will actually have a
4:23
width of the chart to be around
4:26
70% and I will just give it a margin
4:30
zero Auto just to make it in the center
4:33
and in the h2 tag we'll simply say sales
4:36
data line chart and after this we will
4:40
have the line component and it takes the
4:43
actual data and the
4:50
options so here we are rendering this
4:53
line chart passing the data with the
4:55
options that we configured so if you
4:58
refresh your browser you will see this
5:00
chart being
5:01
plotted so this is your set of data that
5:04
you have this is the month name on the
5:08
x-axis and on the y axis we have the set
5:11
of points so it has plotted the salves
5:14
data and you can change the color
5:24
accordingly so in this way you can
5:26
change any color
5:42
so you can see that so the color has
5:45
been successfully changed so in this way
5:47
you guys similarly you can plot more
5:50
type of charts you can read the
5:52
documentation of chart GS and just lot
5:56
like this so I shown you very simple
5:58
example of chares how to use it in react
6:02
CHS thank you very much for watching
6:03
this video and do check out my website
6:05
as well free media tools.com which
6:08
contains thousands of tools regarding
6:11
audio video and MH and I will be seeing
6:14
you in the next video