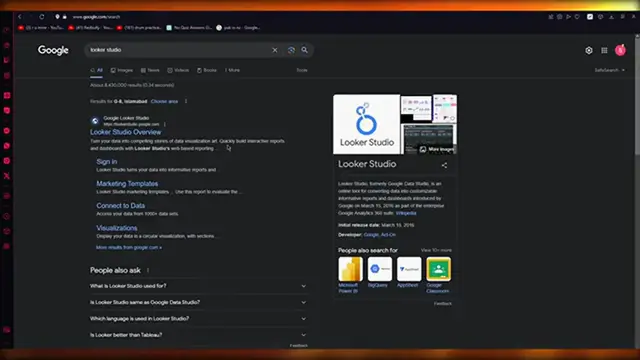
Master Google's Looker Studio with this comprehensive beginner's guide for 2024! Learn how to transform your data into stunning interactive dashboards and reports. This step-by-step tutorial covers everything from connecting your data sources and creating your first visualization to building advanced interactive reports. Perfect for marketers, analysts, and business owners who want to make data-driven decisions. No coding experience needed—discover how to create professional dashboards that tell your data story effectively.
Show More Show Less View Video Transcript
0:00
Looker Studio tutorial for beginners step by step
0:03
Hello everyone. Welcome back to another video. I hope you all are doing great and are having an amazing and absolutely incredible day
0:11
In this video, we're going to be talking about Looker Studio and how we're going to be able to use this amazing application
0:18
Okay. Now, basically, Looker Studio is a Google application, okay? and it's a very popular Google application because what it does is it basically sets your data accordingly
0:33
You could say it's very close to a CRM because the data management is just like on a CRM
0:40
and it's really fun to, you know, it's really fun to use it
0:46
It's really fun to mess around with its information and features. And we're going to do all of that in this video
0:51
So please make sure to watch it till the end so you can get the whole. point of it. So let's get straight into it. So to get straight into this, we're going to go over
0:59
to lookerstudio.google.com. Now once you head over to looker studio, it's going to load things in
1:06
and obviously we're going to sign in with our specific Gmail account. Okay. Now, once you've
1:13
signed in with your Gmail account over here, Looker Studio has a very Google Drive interface when it
1:19
comes to the tab on the left side. So there's the create interface. The recent shared with me
1:24
owned by me in trash. Okay, we're going to get into templates in a bit
1:29
But first of all, let's talk about these things. So create. Now, in create, you get three things
1:36
You get report, data source, and explorer. And we're going to be creating all three and seeing what's really in this
1:42
So let's go on report. Now, when you create a report for yourself, it's going to open up a blank page
1:50
And first of all, it's going to tell you to integrate things. So here are your integrations There Google ytics Looker Google Ads sheets et cetera You can obviously integrate things to transport or import data
2:05
Like, let's say you want to import some data from your Google Sheets. You want to import data from BigQuery because BigQuery, you know
2:11
clearly has different custom queries and tables that you could want to import
2:15
So you can actually integrate with these things if you want to
2:20
or you can add your own data sources if you want to. These are obviously sample data sources
2:25
that you could potentially add. And it's pretty easy to add data to these reports
2:32
Now, if your report is obviously empty, you are going to need to add data
2:38
So that's why you can either do an integration or I'm just going to go with some sample report
2:44
So let's go with the world population data. I'm going to go ahead and add the sample report
2:48
and let's see what we get. So we're going to get a basic chart or graph type thing over here
2:55
I'm just going to increase its size. Okay, there we go. I've increased its size, and as you can see, as we scroll up and down, we can go through
3:03
the different details and data that it has about itself. So, you know, population of every country ranked from highest to lowest
3:11
Now, once we've gotten that, you can actually edit things and show its properties
3:18
Now, here are the different chart properties on the right-hand side. Under data source, first of all, you get blend data
3:27
So basically, in blend data, you can configure different joins between tables and blends
3:33
So you can configure this data with or you can blend this data with different types of data or different types of tables that you have
3:40
Now, currently, I only have one table. So it wouldn't really, you know, change anything
3:46
Yeah. Now, in the table, you also have different fields. So first of all, you have the country feel
3:53
field okay then you have the country code year field etc you could blend these types of information with another table so let say I going to add another table Let say I going to add the AdWords data These two don really combine with each other but you could merge them
4:10
You could merge their data. So let's say I am going to go ahead, add a dimension in this
4:17
I'm going to go with campaign. And in this case, I'm going to add the metric that correlates to the metric on the left-hand side
4:25
I'm going to go with date, let's say, just to give you an example. Now, in the case, if this metric can be added, you will need to delete it
4:33
I'm going to go with one of these. And once you go with one of these, basically just go ahead and blend the data for yourself
4:41
And that basically blends the data of both tables in one place
4:45
This obviously helps in the case that you have two tables of the same niche or category
4:52
and you don't want to separately go and look at them up and down
4:56
You can just create a blend of data dimension and everything should be good to you
5:01
So yeah, this is how you're going to blend data. And you can obviously change the views of this chart as well
5:07
So right now it's in the table view. You can go a table with bars
5:11
So as you can see, it gives you a different bar view over here. Now, once you get a bar view, you can also change it to different, like many different views
5:20
It's really fun to change. change these views and you can go with different types of views there's even pivot tables okay
5:27
which is not really common with apps like these with data apps like they don't just give you a pivot
5:32
table the only app that i've seen giving me a pivot table would probably be Microsoft Excel
5:38
okay so you can just check all the types of data using these things that you have now you can also
5:46
mess with the styling of your map okay or the styling of your chart
5:52
So you can change the colors you can change you know all the certain things that you want So pretty easy pretty specific stuff pretty nice and you know pretty good features to add Now once you made this you can also share these graphs with any person that you know you want to send it to
6:11
You can add their names over here, or you can share a link with them. It's pretty easy
6:15
Now, once we have talked about this, you can also add different charts of different data widgets
6:22
Add different controls as well. So you can add a drop-down list in your data, fixed-size list, input box, advanced filters
6:30
preset filters, data control, and a whole lot more. Adding images, text, lines, shapes, themes, and layouts
6:36
All of it's pretty simple and a piece of cake. So, yeah, basically, that's how you can actually make a data or a report, basically
6:47
Then obviously you can add different data sources, as I said, for yourself
6:51
And either you can go with your own data. sources that you uploaded recently that you can go through with my data sources or you can as I said go ahead into your integrations and in your integrations you can find a whole lot of these different data and ytic managers that you can use to manage all your data around and create new data sources basically so pretty basic and pretty easy stuff to get your head around
7:24
And that's the basic idea of how we're going to be using Looker Studio
7:30
So that's what Looker Studio is. It's not too complicated. It's just our data representation application that Google made
7:37
It's good to represent data. It's good to make charts about data. And it's good to summarize your huge widgets of data into one page
7:46
So yeah, that's about it when it comes to discussing Looker Studio
7:50
Now, if you enjoyed watching this video, please do make sure to drop down a like, subscribe to the channel and yeah that's pretty much about it i hope you all have a great day and i'll see
7:58
all of you next time goodbye
#Data Management
#Internet & Telecom


