Up next in 10

Master ReportLab in Python to Build Student Marksheet PDFs with Form Fields and Image Full Tutorial
Jan 9, 2025
Get the full source code of application here:
https://gist.github.com/gauti123456/0a8eb42d70dd9c681c84563b432d33c1
Show More Show Less View Video Transcript
0:00
uh Hello friends welcome to this video
0:02
so in this video we will look at a
0:04
simple python script by which we will be
0:08
generating a PDF document inside that we
0:10
will be generating a simple form and we
0:13
will fill that form it's a student
0:16
registration form of school where we'll
0:19
be showing the School logo and then
0:21
we'll be having a simple title we will
0:23
provide these fields right here first
0:25
name age percentage gender profile
0:28
picture and we'll generate this
0:30
form filled automatically so we will be
0:34
looking at how to do this in Python
0:36
using a library called as report lab
0:39
report lab if you don't know it's a PDF
0:43
generation library in Python very famous
0:45
open source Library if you just write
0:48
report lab it will simply has its own
0:52
website as well so it's a python library
0:55
for generating PDF so we'll be
0:57
generating the simple form which will
0:59
have these fields first name age
1:01
percentage gender so now to get started
1:05
first of all you need to install report
1:08
lab Library so right inside your
1:11
directory pip install report lab so this
1:15
is actually the command that you need to
1:17
install so let me just open my zoom in
1:20
tool so that I can zoom in on particular
1:26
region so basically guys this is
1:28
actually the command here you you need
1:30
to P install report lab this is a actual
1:33
dependency I've already installed it so
1:36
after you do this you need to make a
1:38
simple app.py file in your root
1:41
directory and uh here we need to import
1:45
some dependencies from report lab lib
1:49
page
1:53
sizes so first of all what I will do I
1:56
will Define a
1:57
function which will create the actual
2:02
PDF document so create student
2:05
registration form and it will actually
2:08
takes uh three arguments first argument
2:11
it take is the output PDF path so where
2:14
you need to create that PDF document
2:16
then the
2:18
secondly it takes a logo so this logo
2:22
will be coming of the particular school
2:24
so this will be present in my root
2:26
directory the PNG file image file and
2:28
the third one is the profile picture of
2:30
the student this will also be present in
2:33
my root
2:35
directory so we will be providing these
2:37
three three arguments to this function
2:39
so in this function so if you see in my
2:41
root directory I have this uh School
2:44
logo and the profile picture of a
2:47
student
2:48
so now what we need to do we need to set
2:52
up
2:55
the doc PDF document for setting up the
2:58
PDF document we will be using the
3:01
canvas so this canvas will be coming
3:04
from report lab so right at the very top
3:07
we need to import this from report lab
3:10
PDF gen from that we need to import the
3:13
canvas class you can see
3:15
that from this we are importing canvas
3:18
and here we are using canvas right here
3:21
so inside this canvas this contains a
3:23
method canvas and here you need to
3:26
specify your output PDF path that will
3:29
be passed so output PDF path and here
3:32
the second argument it takes is the page
3:35
size page size and I will simply choose
3:39
the A4 size which is a standard size in
3:42
PDF
3:43
document and then we will simply make
3:46
two more variables width and height of
3:48
the PDF document will be equal to A4
3:51
size and now we just need to draw the
3:54
logo of the school at the top so now to
3:59
draw the logo at the very top what we
4:01
will do we will use basically this
4:05
object that we created PDF and it
4:07
contains a function in report lab draw
4:10
image so if you want to draw image in
4:13
the PDF document we use this draw image
4:16
function so this takes some arguments
4:19
first it takes the logo where is the
4:22
image path so we are actually getting
4:23
this in the second argument so we are
4:25
simply passing the path here so it is
4:27
present in my root directory and then it
4:30
takes the second argument is the x
4:32
coordinate so whatever is the width of
4:34
the image we will divide this by two and
4:37
then minus 50 so this is actually the
4:39
formula that I calculated already you
4:42
just need to copy this and then the y
4:44
coordinate so x coordinate and the y
4:46
coordinate so y coordinate will be equal
4:49
to whatever is the height of the image
4:51
minus
4:52
100 and then it takes the width of the
4:55
image which will be equal to 100 and the
4:58
height is equal to 100 you can just set
5:00
the width and height to anything so this
5:03
is actually the function guys draw
5:06
image it actually draws the image on the
5:09
PDF document it takes four arguments
5:11
first the logo path then the x
5:13
coordinate y coordinate width and height
5:16
after we do
5:19
this I just want to first of all save
5:22
this PDF document and just show you so
5:25
in order to save this we have the save
5:27
function so you'll simply call this save
5:29
function in report lab and we simply
5:32
print a simple statement on the screen
5:36
that the
5:39
PDF
5:41
saved as whatever is the path which we
5:45
provided output PDF path that's all so
5:50
what it will do uh basically when we
5:53
call this
5:54
function so we will simply say
5:57
output you will create some variables
5:59
right right
6:00
here so output PDF basically the file
6:04
name which will be given when the file
6:06
will be generated so let me call this as
6:08
student marksheet
6:11
dopdf and then the SEC we need to also
6:15
provide the logo image of the school so
6:19
it is already present in my root
6:21
directory
6:22
logo.png if you see this file we will
6:25
provide
6:27
this and also the profile picture of the
6:30
student so you'll be creating a variable
6:32
profile
6:35
picture so it is present in the root
6:37
directory profile. jpg so now we call
6:41
this function create
6:43
student this function that we create so
6:45
you'll simply call this
7:00
so inside this function we need to
7:03
pass the output
7:07
PDF the logo
7:10
image and the profile
7:15
picture so here we are simply calling
7:18
this function create student
7:19
registration form this is a function
7:23
so we simply calling this so if you now
7:27
run this file now if you see
7:30
python
7:31
app.py you will actually see it is
7:34
saying to us that uh A4 is not defined
7:39
sorry we do need to import this A4 as
7:41
well from report lab so right at the
7:44
very top we do need to import the size
7:46
as well so from reportlab doli do page
7:50
sizes from that we need to import the
7:53
page size which is A4 you can see
7:57
that so now if you
8:00
run this you will see PDF saved as
8:03
student
8:04
marksheet so if you see there is this
8:07
student marksheet PDF file has been
8:10
generated and if you open this you will
8:12
actually see this uh School logo being
8:16
added at the very top so this is a logo
8:18
of the school which is added now we need
8:21
to actually add the marksheet as well
8:23
all the fields form Fields so after this
8:27
logo so what we need to do after
8:30
this we now need to add the title so for
8:34
adding the title we will uh once
8:37
again use first of all set the font by
8:40
using the set font function so here we
8:42
will set the font
8:46
Hela bolt you can set any font of your
8:49
choice so the font size will be 16 and
8:52
then we'll be draw the text so now to
8:55
draw the set text in the center position
8:58
we will use this function
9:00
draw centered
9:04
string and this function takes two
9:06
arguments first is the width of the text
9:09
width divided by two and the height
9:12
minus
9:15
130 so whatever the text that you want
9:17
to give in the third argument so I will
9:19
simply say
9:21
student registration
9:24
form so you will see we are using this
9:26
function right here draw centered string
9:28
so it will add add this text so if you
9:32
run the script once again you will
9:34
actually see your title is added student
9:37
registration form now after this we now
9:42
need to add the form
9:45
fields which will be the first uh name
9:48
age gender and percentage so for adding
9:52
those fields you will declare a array
9:55
here form labels so in this array we
9:58
will provide the Fields right here which
10:00
is first name and we'll provide the
10:03
value here so sample value John
10:07
Williamson and then the second one is uh
10:10
you can change these values
10:13
accordingly and then the
10:17
AG it's a numeric value so it will be in
10:20
20
10:24
so so in this way you will add all these
10:27
uh percentage
10:30
then so the percentage will come out to
10:32
be again a numeric value
10:39
85% so we added these three Fields first
10:42
name age and percentage and now we need
10:45
to calculate the Y position of these so
10:47
we will create a y position variable so
10:50
whatever is the height we will subtract
10:52
180 from
10:54
it and then after that we need to add
10:57
these labels so we will use a for Loop
11:00
for label data in form
11:05
labels so whatever is basically the data
11:08
right here this data that we are talking
11:10
about we are adding it using for Loop
11:13
you can see that and for each entry we
11:16
need to use
11:18
the draw string method draw string
11:22
method and here you need to provide the
11:24
x coordinate which is 100 and the Y
11:27
position that we calculated we will
11:28
replace
11:32
it and then the actual label that we
11:36
need to add and secondly the actual
11:39
value as well so again we'll use the
11:41
draw string function the x coordinate
11:44
Will Change to
11:46
200 the Y Position will still remain the
11:49
same and the actual data that is present
11:54
so this is actually the label and this
11:56
is the data
12:02
so if you refresh
12:05
now you will see that invalid
12:10
syntax I think let me see okay colon is
12:13
not required is comma sorry here just
12:17
replace comma here not
12:19
colon so if you refresh again refresh it
12:23
you will actually see uh these entries
12:26
are overloaded you can see that it is
12:29
not looking good we need to have some
12:31
space in between these uh form Fields so
12:35
now for the spacing we need to add one
12:37
more line after this we need to draw a
12:41
vertical line so we can do this inside
12:44
report lab using the line function and
12:47
here we need to provide the first
12:48
coordinate to be x coordinate to 200 and
12:51
the Y position we already know so y
12:55
position
12:57
subtract minus 2 and then the width of
13:00
the line
13:01
400 again the Y position is the same
13:05
this is just some mathematics guys we
13:07
already calculated these so you can copy
13:10
this and then we will need to subtract
13:13
the Y position every
13:16
time by
13:18
30 so if you just refresh
13:22
now and see your things you will see
13:25
that first name age percentage and in
13:28
vertical line we basically put these
13:31
entries John Williamson age 20
13:33
percentage
13:34
85% so in this way you can add your
13:38
entries so just you need to put call in
13:42
here so after we add this we also need
13:46
to add the gender ratio field so for
13:50
adding that gender we will need to add
13:53
the radio button for
13:55
that we will have two choices either
13:57
male or female what do doing this we
13:59
will again use the draw string
14:03
function so you'll simply say x
14:06
coordinate 100 y
14:09
position we already know so whatever is
14:12
the
14:18
gender so now for the gender we will
14:21
basically have two choices again we'll
14:23
use a draw string function x coordinate
14:25
will be 200 y position we already know
14:31
and the first choice will be
14:35
male and here we'll in order to use a
14:39
radio button we need to draw a circle
14:42
right here
14:44
so we'll use a circle method inside
14:47
report lab to draw a circle x coordinate
14:51
will be 200 sorry
14:53
240 and Y position is the same you will
14:59
basically add three to
15:01
it and five stroke of the circle will be
15:05
one and the fill is equal
15:09
to
15:11
Zer so fill zero means that the circle
15:14
is
15:15
filled so by default mail will be
15:18
selected so we put the fill entry to be
15:22
zero similarly we'll be having the
15:24
second entry which is female so we'll be
15:27
adding again draw string function fun x
15:30
coordinate here will be changing to
15:32
255 y Position will be the same and it
15:35
will change to
15:38
female again you'll be using the circle
15:42
method this time the fill value will be
15:45
one because it not it will not be filled
15:48
so fill is equal to 1 so this x
15:51
coordinate Will Change to 3 110 3 110
15:55
and Y position we need to add three to
15:58
it
16:01
all the rest of the things will remain
16:03
the same so we also need to subtract y
16:07
position minus is equal to
16:11
30 so if you make this change refresh
16:14
you will see your entry
16:18
added male 30
16:23
female all the source code that I use
16:26
guys in this video is given in the
16:27
description you can
16:32
uh up till now we have done this let me
16:37
just I think some typo mistake has
16:40
happened let me just paste
16:43
it
16:53
okay this is for the gender field okay
16:56
this is for the gender field this will
16:59
outside of
17:04
this so if you refresh
17:09
it so it will now look something like
17:11
this you'll see that this is a logo this
17:13
is a title then we have these three
17:15
Fields first name age percentage then we
17:18
have the gender here uh by default if
17:21
you want to select male so you need to
17:23
put the fill property to here one and
17:28
the female to be zero so now if you
17:31
refresh mail will be selected you will
17:33
see
17:34
that so these are the radio buttons now
17:37
coming back to the profile picture now
17:40
to show the profile picture which we
17:42
have already in the file system we will
17:46
use the again draw string function x
17:49
coordinate is 100 y position is the
17:53
same we subtracted 20 and you simply say
17:57
profile picture
18:04
so now to draw the image we'll use again
18:07
use a draw image function and here we
18:10
need to provide the path here which we
18:12
passed profile picture path x coordinate
18:15
is uh
18:17
200 Y is equal to the Y position that we
18:22
have and we need to subtract it minus 80
18:26
here and the width of the image will be
18:29
100 and the height will also
18:33
be
18:36
100 so if you refresh now your image
18:39
will also get added you can see that
18:42
this is your profile picture which is
18:45
added you can just see we have added all
18:47
the
18:52
things and now if you want to add a
18:55
footer line right at the bottom we can
18:58
simp simply add the footer line by using
19:02
set stroke color you set the stroke
19:04
colors to be
19:07
black and then we just draw a simple
19:10
vertical line at the very bottom to
19:12
signify that there is the end of the
19:23
document so at the very last if you see
19:26
we have drawn a simple quter line at the
19:30
bottom so this is actually your document
19:32
guys here you can change the values
19:34
accordingly whatever values that you
19:36
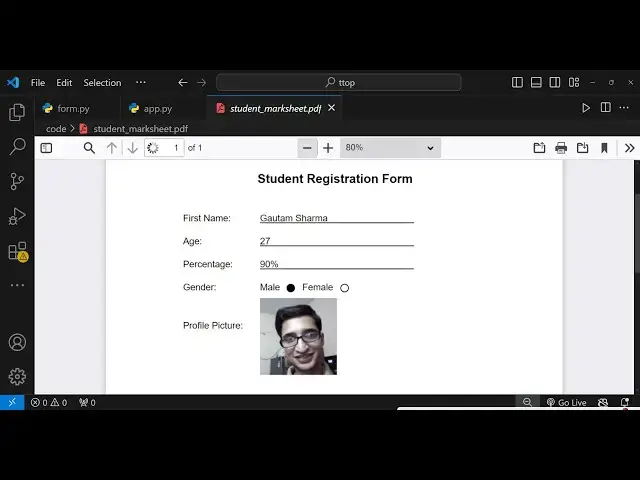
want to change let suppose I change this
19:38
from John Williamson to
19:40
goam age let me change to
19:44
27 percentage 90 so in this way you can
19:47
generate unlimited number of records for
19:50
the document you can see the names have
19:52
been
19:52
changed so if I show you this marksheet
19:55
which is
19:57
generated so in this way you can easily
20:00
generate PDF documents which contains
20:03
form Fields inside report lab in Python
20:06
you can change these values accordingly
20:08
profile picture you can change it all
20:11
these records you can change it the logo
20:13
of the School logo you you can replace
20:15
your own logo in this way you can make
20:19
any sort of form inside report lab any
20:23
the full source code is given guys in
20:26
the description you can check out that
20:28
and if you still for any problem you can
20:30
comment on this video please hit that
20:32
like button subscribe the channel as
20:34
well and do check out my website as well
20:37
free mediat tools.com which contains
20:40
free tools regarding video image and
20:42
audio so do check this website as well
20:45
and I will be seeing you in the next
20:46
video
#Training & Certification
#Scripting Languages
#Computer Education