live_tv
Livestream Starting Soon
00
Hours
:
00
Minutes
:
00
Seconds
Up next in 10

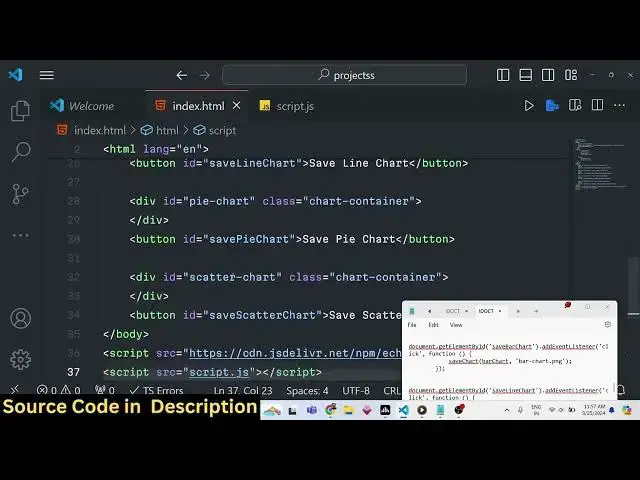
Javascript EChart.js Exampe to Visualize Data in Bar,Pie & Line Charts and Export to PNG Image
Jan 9, 2025
Buy the full source code of application here:
Show More Show Less View Video Transcript
0:00
uh hello guys welcome to this video so
0:02
in this video I will talk about a
0:05
JavaScript library which is called as e
0:08
charts.js so this Library allows you to
0:12
actually make these bar charts line
0:14
charts pie charts and Scatter charts and
0:19
it's basically it's a charting
0:21
Library where you can actually draw
0:23
these uh charts using some kind of data
0:27
and also we can export these charts to
0:30
PNG image as well so individually you
0:32
can click this button to actually export
0:34
these charts to a PNG image file so that
0:37
you can see these charts so we can take
0:41
any data for example so this is actually
0:43
a bar chart where we actually taken this
0:46
data this is the x-axis this is a y axis
0:49
similar this is actually a line
0:53
chart so similarly we can export this to
0:56
a PNG image file then this is actually a
0:59
p chart where you can see
1:04
that so we can even export this pie
1:07
chart as well in the form of a image
1:10
so and then this is a scatter chart so
1:13
it's a very handy Library if you want to
1:17
do some kind of uh plotting and charts
1:23
so if you just type on Google earts
1:27
JS the very first link which comes this
1:30
is actually the documentation about
1:33
echarts I think this is actually the
1:35
Apache echarts this is the name of the
1:38
library open source JavaScript
1:41
visualization Library if you want to
1:43
visualize something on the browser in
1:45
the form of charts you can use this
1:48
library and in this tutorial we will
1:50
look at a very
1:52
systematic simple example in the browser
1:55
how to get started with this so I will
1:58
delete everything and start from scratch
2:00
so all the source code which is used in
2:03
this video is given in the description
2:05
so the very first thing we will need to
2:07
do we need to include the CDM of this
2:17
Library you can just uh write
2:26
here CDN and uh you can go to this
2:29
website and grab the JavaScript part or
2:33
you can go to their official website as
2:35
well and then click on examples
2:39
and so documentation is good you'll see
2:42
example for each and every chart so it
2:45
supports multiple charts we will take
2:47
example of the four basic ones so first
2:51
of all you need to include the script
2:53
tag this is actually the
2:56
library this is actually we have
2:59
included the C DN for this library now
3:01
we can use
3:03
this so now in the HTML we will actually
3:06
be
3:07
having four div tags
3:11
for having these four types of charts so
3:15
the very first chart we will say bar
3:17
chart we will give it an ID to
3:23
it and after this we will have a simple
3:26
button below this to actually say if you
3:29
want to export this save bar chart so
3:33
you'll be giving an ID to it save bar
3:37
chart similarly I will copy this and
3:41
paste it three more
3:46
times the second one
4:00
so here we need to change the ID this
4:03
one we need to
4:05
give line
4:09
chart and also here also we need to
4:12
change it save line chart
4:34
so you can now change this to save line
4:37
chart and the third type of chart is pie
4:41
chart so we'll give this one to pie
4:45
chart this button will this ID will be
4:49
save by
4:54
chart and the fourth type will be
4:58
scatter chart
5:00
just change the ID here
5:14
scatter so if you open this now you will
5:17
actually see four
5:20
buttons so you just need to write some
5:23
basic CSS for this so we will Target the
5:27
chart container class which we have
5:29
given to each of the div elements so
5:32
we'll give it a fixed width to it of 600
5:35
pixel and a height of 400
5:38
pixel and also a margin of 20 pixel
5:44
Auto and also you'll be targeting the
5:46
button tag and inside the button you'll
5:49
be changing the display property to
5:51
block and margin 10 pixel
5:56
Auto so each and every div will have a
5:59
fix fixed width right here you will see
6:01
that now we need to actually include the
6:06
custom JavaScript code that we will
6:07
write so just make a script
6:10
tag and include the
6:12
script.js so we are including this
6:14
custom script.js right inside this uh
6:17
JavaScript code now we need to get all
6:20
the
6:22
references of the div elements to
6:24
initialize the charts so what we'll do
6:27
we will declare the variable
6:30
let bar
6:34
chart so we need to initialize it using
6:38
e charts so in this way you can
6:41
initialize them this contains a function
6:43
called as init and here you need to pass
6:46
the reference of the chart element so
6:50
here you'll be passing the reference so
6:52
you will
6:52
be getting the
6:55
ID which we have given to the bar
6:58
chart so here we are passing the ID that
7:01
we have given to the div
7:03
element so we are passing
7:05
directly to this function so similarly
7:08
we'll be declaring
7:10
the three charts which are there which
7:13
is this one will be for the line
7:17
chart here we'll be changing the ID to
7:19
line chart then we have the P
7:25
chart and this one will be the scatter
7:29
chart
7:33
so now we have initialized all of these
7:36
charts one by one by using this innit
7:38
function right here and uh now we need
7:41
to assign the data so by using that data
7:45
we will be constructing these charts so
7:49
first of all all we will be having the
7:52
bar chart we'll be declaring a bar
7:55
option object so inside this option
7:58
we'll be having some configuration
7:59
object which is actually the title of
8:01
the chart so this contains two
8:03
properties sorry First Property will be
8:05
the title which will be saying bar chart
8:08
the second property here will be
8:12
x-axis so as you know in charts we have
8:15
x-axis and the y axis so here we'll be
8:17
providing the data here you can take any
8:20
data for example if you want to to
8:23
plotting so let's suppose I say here
8:27
shirts
8:29
or I take here any data you can
8:40
take so we have taken the team names in
8:44
the
8:48
x-axis and now similarly we have the Y
8:51
AIS as well but for the bar chart here y
8:54
AIS will be empty so here we'll be
8:57
providing empty object
9:00
so here we need to provide the data for
9:02
the xaxis that we declared these team
9:04
names we now need to give some values to
9:06
it so now in the series option right
9:08
here we will be giving this square
9:11
brackets inside this we will
9:15
have the type parameter which is bar and
9:18
the second property will be the
9:21
data so this data can be anything it can
9:24
be number value it can be string value
9:26
it can be floating Point number
9:28
accordingly so I will give some numeric
9:31
value here 5 20
9:36
36 so now if you check in
9:40
the and lastly we need to set this
9:43
option with the bar chart so you'll say
9:45
bar chart there is a method right here
9:48
in the inside e charts which is set
9:50
option and here we need to pass this bar
9:53
option which we
9:54
constructed so now if you check the
9:57
browser you will actually see a bar
9:59
chart has been constructed with the data
10:01
that we have provided in the x-axis we
10:04
have the team names like Australia India
10:06
New Zealand West indes and on the YX on
10:10
the values we have this so depending
10:14
upon how much value that you have
10:15
provided so you can see how the bar
10:19
chart looks like so you can just modify
10:22
all these
10:24
values let me change this 5 to 45 so now
10:27
this the length of the the bar chart
10:30
increases so this is a very basic Way by
10:33
which you can make simple bar charts in
10:36
browser so now if you want to export
10:39
this into a image file if I click this
10:41
button so how we can do that we can
10:43
actually bind a simple method which is
10:45
available inside e charts if you want to
10:49
save the charts or export this into a
10:51
image file so we can actually construct
10:54
a function right here save chart and
10:56
we'll be passing the chart and the file
10:58
name as
11:00
argument so inside this function what we
11:02
will do we will actually convert this
11:04
bar chart to a base 64 by using a
11:08
function which is get data
11:10
URL this is actually present as a
11:14
buil-in function inside e charts this is
11:16
not any third party function we are
11:18
using it is already built in inside e
11:20
chart JS so it takes three properties
11:23
first is the type which is a PNG image
11:26
and then we take is the pixel ratio
11:29
which is two and then the background
11:31
color of the chart so you can select any
11:35
background color you can provide
11:37
hexadecimal code or rgba value let me
11:40
provide here ffff this is actually for
11:42
white color heximal code after we
11:46
construct this object now we just need
11:48
to Simply download this as an attachment
11:51
so we will be doing it simply by using
11:53
anchor tag we'll be creating it
11:55
dynamically then we will be attaching it
11:58
this image data
11:59
which is a base 64 code then we will
12:02
simply download This by using ding.
12:04
download and we'll be giving a file name
12:06
which is passed and then we'll be
12:08
clicking it
12:10
dynamically so now we have actually
12:12
written this function now we simply need
12:14
to call this so once we we can bind this
12:18
function as soon as we click
12:21
the save bar chart button so we have
12:25
given the button and ID here so when we
12:28
click this button we will
12:30
execute this function which is uh save
12:35
chart and here we will be passing the
12:39
reference of bar chart and the file name
12:42
so you'll be giving a bar
12:44
chart.png so if you now refresh and
12:48
click this
12:53
button so if you see your as soon as I
12:57
refresh nothing happen happens because I
13:01
think save bar
13:03
chart let me see in the index. HTML save
13:08
bar
13:11
chart ID is
13:14
correct save bar
13:18
chart
13:20
okay we can't directly call this
13:22
function right here we need to write it
13:24
like this so here we need to do this
13:27
like this so we we we can't directly do
13:30
this we need to uh write this function
13:32
like this so once we click the button
13:35
this Arrow function will execute and
13:36
inside this we are calling this save
13:38
chart function we are passing the
13:40
reference of bar chart which is actually
13:42
this uh object that we declared this
13:46
variable and the second parameter we are
13:48
passing the file name which is bar
13:50
chart.png so if you refresh click this
13:53
button and now if you see the image file
13:56
is downloaded and it actually taken the
13:58
screen screenshot of this bar chart and
14:00
exported this to a PNG image and you see
14:03
exactly what is available in the bar
14:05
chart in the form of a image so
14:08
similarly we can do this for pie chart
14:10
scatter chart and line chart the logic
14:13
will remain the same I will simply copy
14:15
this three more
14:18
times so I can simply say
14:21
here so whatever is the IDS that we have
14:24
given here which is save line chart so I
14:27
will simply change this to
14:41
this one will be pie
14:51
chart this for be scatter chart
14:57
so in both in in both of the in each of
15:00
these scenarios the same function will
15:02
be called but the arguments will change
15:04
the chart and the file name and
15:07
similarly for the line chart there will
15:10
be set of parameters that we need to
15:14
declare so right here uh we will simply
15:19
say line option and for the line chart
15:22
if you know
15:23
basically we have similarly we have the
15:27
title you need to provide so this time
15:29
this will be line
15:31
chart and now to plot the line chart we
15:34
again have a x-axis so
15:38
xaes we will give some values so data
15:41
here will be array of
15:43
values so again you can
15:47
say we can take similar data the team
15:54
names and then on the
16:04
um y
16:08
AIS will be
16:16
empty and then then again we have the
16:19
series option right
16:21
here here we need to provide the type
16:23
parameter which is actually a line chart
16:26
so again you'll provide the data like
16:28
like this if you refresh now we do need
16:31
to add this so for adding it we can say
16:34
line chart. set
16:36
option so now you can see we have these
16:40
team names appearing in the x-axis you
16:43
can even change the if you want to this
16:46
to appear on the y axis you can even
16:49
change that also so you can do this y-
16:51
axis and delete it from the
16:54
x-axis just make it an empty object so
16:58
now now it will do this something like
17:00
this but uh this is not looking good by
17:04
default we do this on the x-axis
17:08
so so I'm just showing that you can also
17:11
do it on the y axis as well similarly we
17:15
can also do it for the y- axis if you
17:17
don't want
17:19
to we can paste these on the y
17:22
axis so it will look something like this
17:25
so now the data is appearing
17:29
in a vertical manner coming from the y
17:31
axis so you can do it on the x-axis Y
17:34
axis depending upon how you want to
17:36
construct the
17:38
chart and then we come to the pi chart
17:41
so Pi chart is also very similar little
17:44
bit easy to
17:47
construct so in the pi options once
17:50
again we will have the title this time
17:52
this will be P pie
17:57
chart and then we have the series here
18:00
we don't have the xaxis and y axis in
18:02
pie chart we simply need to provide the
18:04
data in pie chart so that is little bit
18:07
easy so here we need to put the type
18:10
here will be pi and the radius we need
18:13
to provide here which is uh you can
18:15
provide any value I will provide 50%
18:18
then comes the data here so data here
18:22
represents uh two things first is the
18:25
value and second is the key parameter so
18:28
so let's suppose I want to provide a
18:30
value here so value represents how much
18:33
share is it takes so let me provide 80
18:37
and then I provide a key parameter or a
18:41
label that you make let's suppose I give
18:44
this 80 to USA which is a key name and
18:48
then
18:50
similarly this is one entry similarly
18:53
we'll put a comma we will write the
18:55
second entry we'll put a value to be 20
18:58
and here we'll name it to be another
19:00
country let's suppose China similarly
19:03
the these are two entries once again
19:05
we'll be constructing a third entry I
19:08
give value to 50 and name let me give it
19:10
Japan now we have three entries in the
19:13
pie chart if you refresh it we also need
19:15
to add this so we can simply say pie
19:18
chart set option Pi option
19:37
uh let me see
19:41
uh we copy this right here
19:45
just Pi
19:49
option so now you can see this is
19:51
actually Pi chart right
19:54
here it doesn't involve any x-axis y AIS
19:58
entities are there and we give
20:00
percentage or value to each entity so
20:03
you
20:08
can this is the you can change these
20:11
labels to anything it can be country
20:14
names it can be items it can be
20:17
anything so value represents how much
20:20
share it is there you can see
20:22
that so depending upon how much value
20:25
you get you basically give to any entity
20:28
it will construct that pie chart to
20:31
you so these are the three most used
20:35
charts visualization types that most
20:38
people use which is bar chart line chart
20:40
and pie chart it also has scatter chart
20:43
as well which is not ESS most widely
20:45
used these are the three specific ones
20:48
and uh all the source code is given in
20:51
the description and this is a very handy
20:53
Library e charts you can read more about
20:56
it documentation is given for each and
20:58
and every chart type that you can see
21:00
right here on your screen
21:04
so you can see that it's a free library
21:07
which is the main thing so no need to
21:09
pay for anything so this was the
21:12
tutorial guys thank you very much for
21:14
watching this video please hit that like
21:15
button subscribe the channel as well and
21:17
I will be seeing you in the next one
#Software