Up next in 10

Python 3 Plotly Script to Create Interactive Visualization Charts From JSON Data in Browser
Jun 1, 2025
Get the full source code of application here:
Show More Show Less View Video Transcript
0:00
uh hello guys welcome to this video so
0:02
in this video I will show you a new uh
0:05
Python library package for plotting uh
0:08
beautiful charts from raw data so this
0:12
package is called as plotly it's a
0:15
famous package or
0:18
library so you just need to go to this
0:21
and simply first of all install this by
0:24
actually executing this command it's
0:26
open-source library interactive data
0:29
visualization library for Python
0:33
so you can have any sort of data it can
0:36
be CSV JSON it can be coming from a
0:39
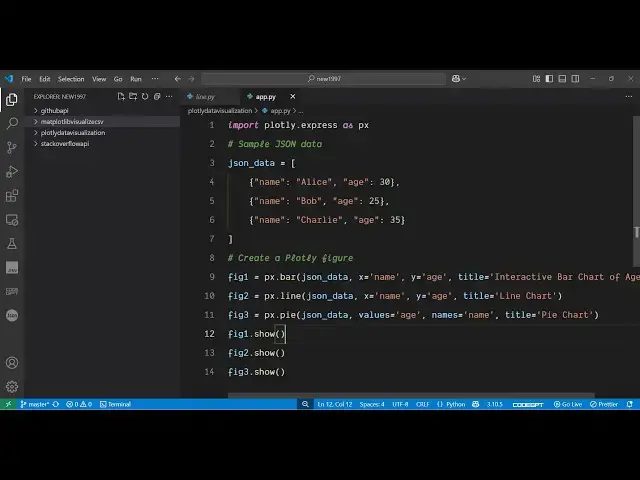
database or API so we are taking a very
0:42
simple example right here we have a set
0:44
of JSON array of JSON objects each
0:47
object is having two properties here
0:49
name and age
0:51
so we are plotting
0:53
this the line chart bar chart and pie
0:56
chart so it actually creates a web
1:00
application where it plots the charts so
1:04
if I just execute this you'll see it
1:07
will open three windows inside your web
1:12
application so it opens a local port
1:15
number where it plots these charts
1:19
so this is actually the pie chart which
1:22
looks something like
1:23
this and the nice thing is that you can
1:26
even click this button to export this
1:28
chart to a PNG file as well so as soon
1:30
as you click it it will take the
1:32
snapshot and then export this as a PNG
1:35
image file so this is your pie
1:37
chart and similarly we have also the
1:40
line chart as well this is actually the
1:42
line chart we have all these controls
1:44
you can pan zoom everything you can do
1:58
and then we have the basic uh bar chart
2:00
as
2:01
well you can adjust the color everything
2:04
you can adjust using this
2:07
package so it actually instead of matt
2:11
plot lib which is also a similar library
2:14
to it plotly is different in the sense
2:17
that it can creates a web application
2:20
instead of
2:21
desktop so it's create a unique URL
2:23
every time for different charts so that
2:26
it is accessible through the web
2:29
internet so now to get
2:31
started for after installing this
2:34
package now to create this it's very
2:37
simple you simply import this package by
2:39
simply writing import plotly.express
2:43
Express as px then you set your actual
2:48
data so this will be a array of JSON
2:51
object each object is having two
2:54
properties
2:56
so so you can take this data from any
3:00
source it can be from database or API
3:03
after that using this data we can plot
3:07
the data right here so we have a series
3:11
of functions right here for different
3:13
kinds of charts here so this one is for
3:16
the bar chart we actually pass the data
3:19
and then the x coordinate which is the
3:22
name the
3:24
y-coordinate you can adjust this and you
3:27
can even give it a unique title to it as
3:30
well
3:33
so after that to show this bar chart we
3:38
simply say we invoke the show show
3:44
method so similarly we have the line
3:48
chart and the pie chart as well so we
3:50
have the series of functions similarly
3:53
we are calling the line chart the pie
3:55
chart so the rest of the things remain
3:57
constant we again need to provide XY
4:00
coordinate and then for the pie chart we
4:02
say
4:03
values and the actual
4:06
names so then you again need to call
4:08
this the show
4:11
method like this
4:13
so so that's all that the configuration
4:16
code is required so once you do this you
4:19
just need to come to the terminal just
4:21
run your application then it will start
4:24
this charts and instantly will open so
4:28
it looks something like
4:32
this so this is a very simple example on
4:34
how to using this plotly package inside
4:37
your Python application and uh also
4:41
check out my website freemediattools.com
4:44
uh which contains thousands of tools
#Software
#Business & Productivity Software
#Scripting Languages