Up next in 10

Machine Learning - The Nature of Probability and Statistics - Descriptive and Inferential Statistics
Oct 18, 2024
Machine Learning - The Nature of Probability and Statistics - Descriptive and Inferential Statistics
https://www.tutorialspoint.com/market/index.asp
Get Extra 10% OFF on all courses, Ebooks, and prime packs, USE CODE: YOUTUBE10
Show More Show Less View Video Transcript
0:00
In this video we are discussing descriptive and inferential statistics
0:06
So, at first we are going to define statistics. Statistics is the science of conducting studies to collect, organize, summarize, yze, and draw
0:18
conclusions from data. So, this is a very simple way to define statistics
0:24
That means, this is a science where we'll be studying our data, which has got collected
0:30
And then we shall organize that data in some representable form. We can summarize
0:35
We can draw some conclusions. We can summarize it. We shall do the ysis
0:40
And obviously, at the end, we shall draw some conclusions, predictions, and forecasting
0:45
on the data. So, definition of a variable. A variable is a characteristic or attribute that can assume different values
0:55
We know that a variable can assume different values. So, we can consider the age of a person
1:01
So, age of a person is nothing but one variable because it can assume different values
1:07
So data are the values, measurements or observations that the variables can assume and variables
1:14
whose values are determined by chance are called random variables. So we know that data are nothing but the values and which will be obtained through some observation or through some measurements and that the variables can assume And the variables whose values will be determined by chance will be known as the random variable
1:38
A collection of data values forms a dataset and each value in the data set is called a data
1:45
value or a datum. So either you call data value or you can call datums
1:52
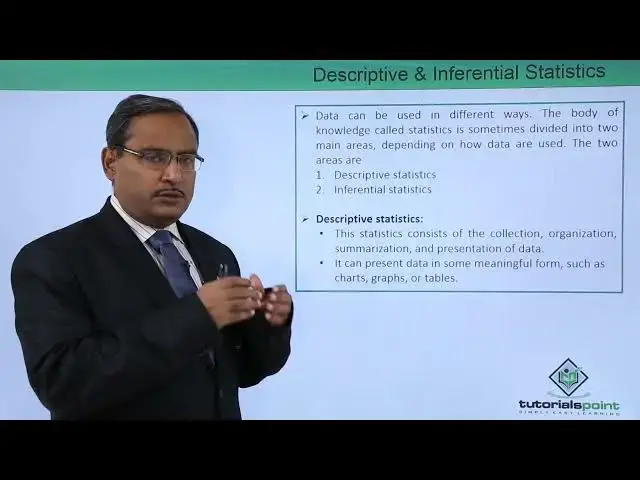
Data is a wrong English because data itself is plural. So, data can be used in different ways and the body of the knowledge called statistics is sometimes divided into two main areas, depending on how the data are getting used
2:12
The two main areas of statistics are descriptive statistics and were having infer maintain statistics
2:20
So, let us discuss them one by one. So, at first, we are starting with the descriptive statistics
2:28
Descriptive statistics, these statistics consists of the collection, organization, summarization, and presentation of data
2:38
So, data will get collected. We shall organize it. We shall draw some summary from the data
2:44
And also, we shall represent some data in some representable, might be in some visual
2:49
representation also It can represent data in some meaningful form such as charts graphs and tables We know that charts and graphs they are the visual representation of our data
3:03
If you go for the inferential statistics, so inferential statistics consists of generalizing
3:10
from the samples to populations and performing estimations and hypothesis tests and determining
3:18
relationships among multiple different variables and also it can do predictions. So, in case of inferential statistics will be going for different hypothesis testings
3:30
we shall calculate some estimates from the sample to the population and determine their
3:35
respective relationships and also among the variables, the relationships, how it is
3:40
occurring, what is the relationship they are having, that will be expressed in our inferential
3:46
statistics. In case of inferential statistics, we're having one extra feature that means this
3:52
particular statistics can go for predictions and forecasting on the present set of data
3:58
after doing the ysis. Here the statistician tries to make inferences from samples to population
4:07
Inferential statistics uses probability, that is the chance of an event occurring
4:12
If you play cards dice bingo and lotteries you win or lose the accordingly to the laws of probability So either you can win or you can lose the game depending upon the laws of probability
4:30
So, inferential statistics use the concept of probability. So let me discuss what is a population and what is a sample
4:40
A population consists of subjects. It may be human or, say, some otherwise, and that are being studied
4:48
So, population means we are considering the whole, the human being, or the others, which
4:54
will be considered, which will be satisfying a certain criteria. So that is known as the population which consists all the subjects
5:02
But in case of most of the time, due to the expense, time, size of the population, medical
5:08
concerns, and whether we are reachable to all subjects in the population or not
5:14
So feasibility, doing all this study, we can, it is not possible to even
5:18
use the entire population for a statistical study. So in those cases, researchers used to go to study samples
5:27
So the samples will be taken from the populations. So samples are nothing but those subjects which have got taken from the population and will
5:35
be doing some research work on them. A sample is a group of subjects selected from a population
5:43
So in this particular video, we have discussed multiple different terminologies which will
5:48
be required in our concept building. Thanks for watching this video
#Programming
#Mathematics
#Statistics
#Web Stats & Analytics
#Machine Learning & Artificial Intelligence
#Sport Scores & Statistics