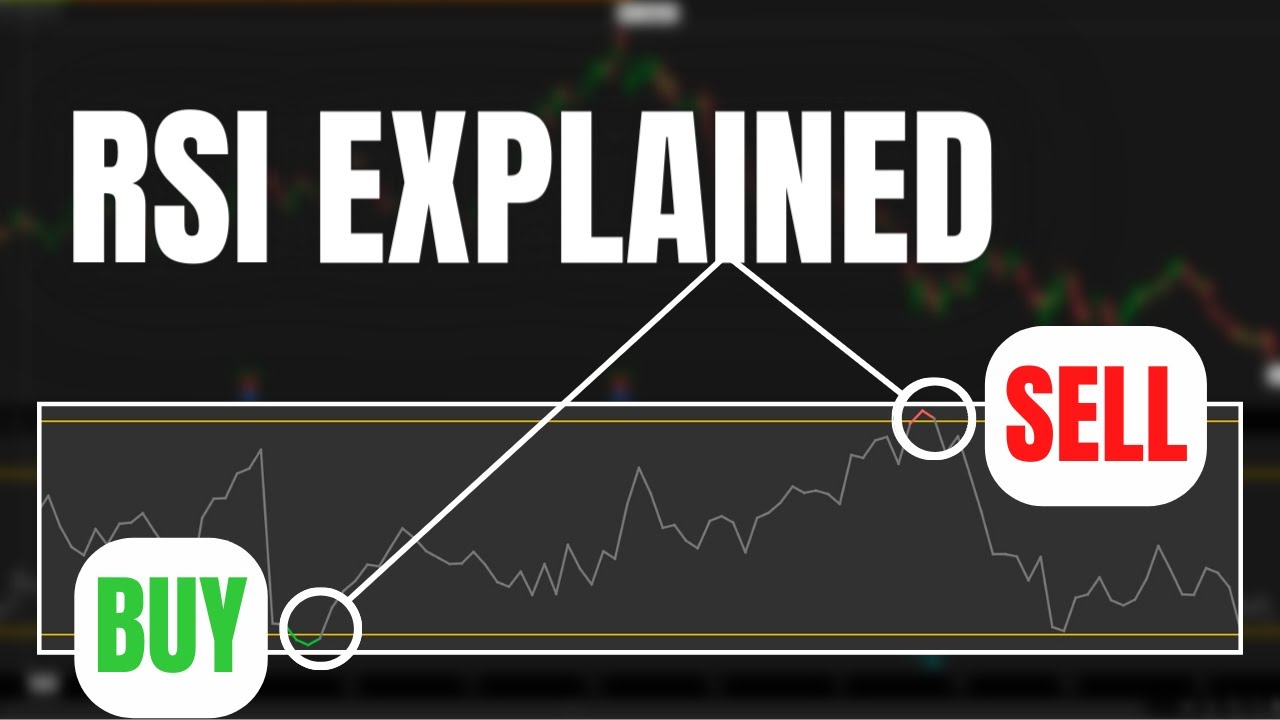
RSI Indicator Explained (Relative Strength Index)
The Relative Strength Index (RSI) is an incredibly popular technical indicator that uses recent price action to evaluate oversold or overbought conditions in the price of a stock. Throughout this video we’ll go over how the indicator is calculated, how
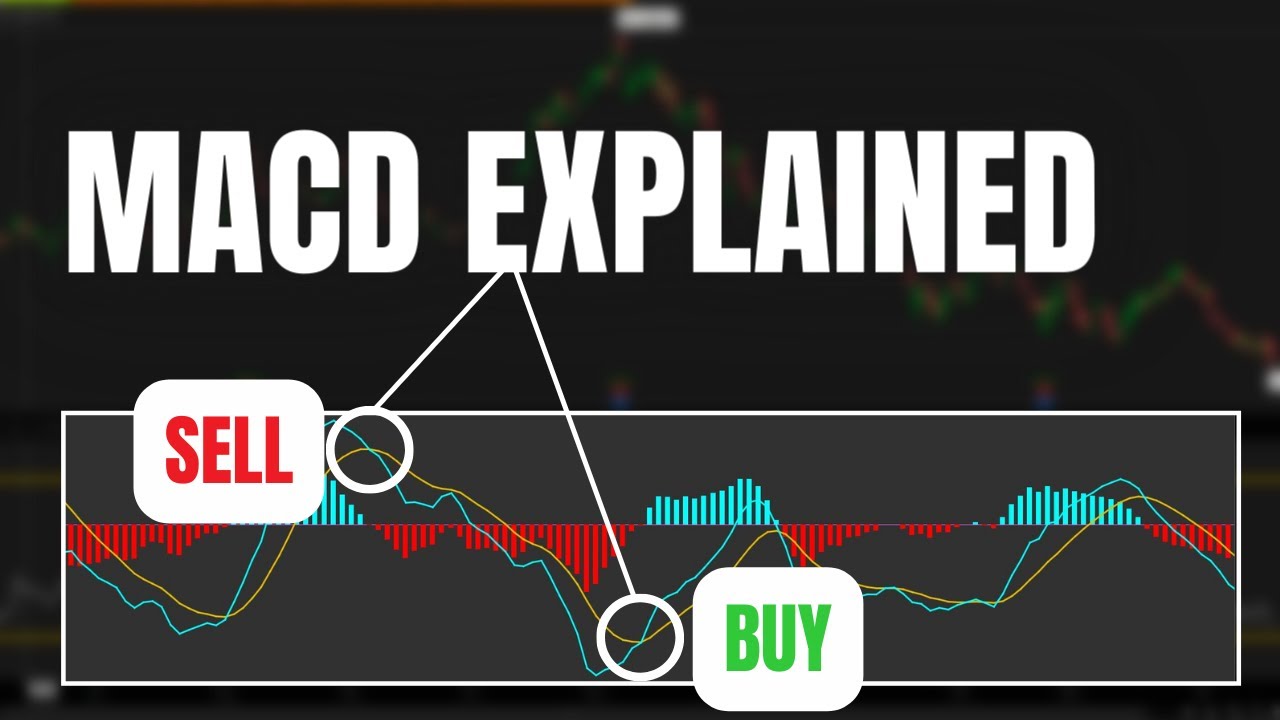
MACD Indicator Explained (Moving Average Convergence Divergence)
The MACD is a popular momentum indicator that traders use to find potential buy or sell signals in the underlying stock. Throughout this video we’ll go over how the indicator is calculated, how it in can be used in practical application and how to creat
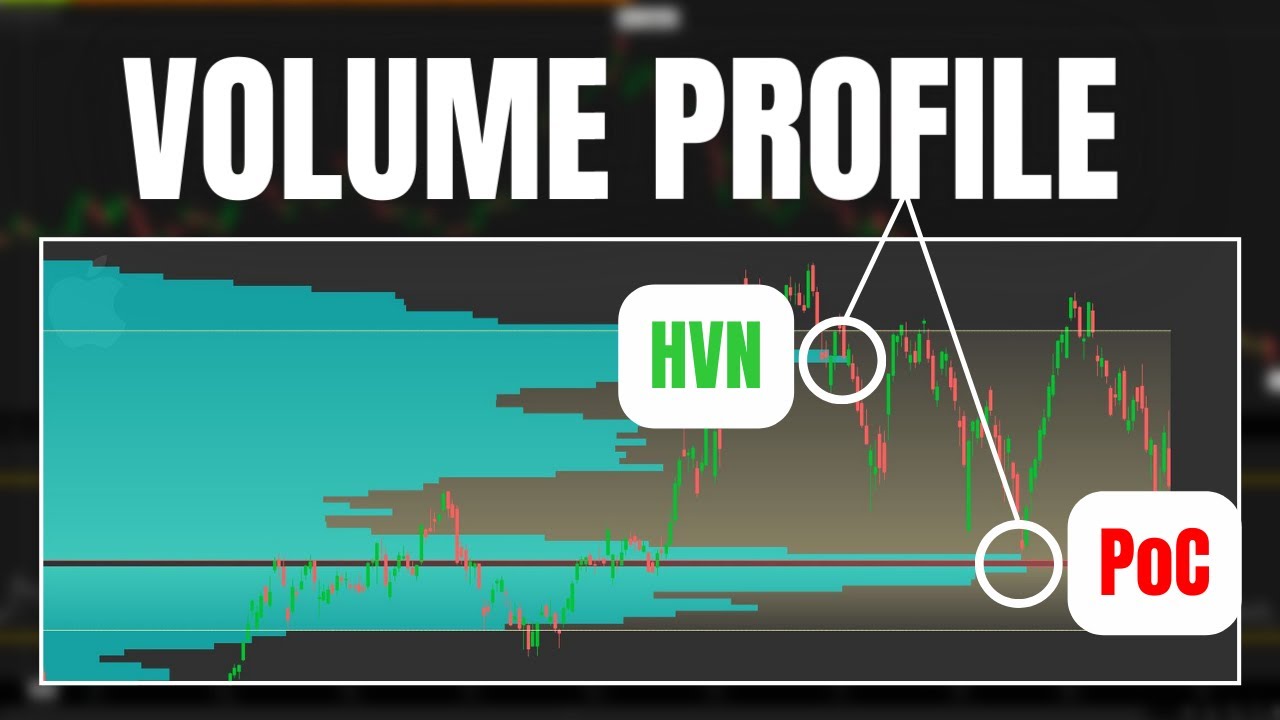
Volume Profile Trading Indicator | How to Trade Using Volume Profile
The Volume Profile Indicator allows you to view where a stock has traded over a certain time period. This indicator may be used to find levels of support and resistance or to find unbalanced markets that may indicate a bullish or bearish trend. Througho
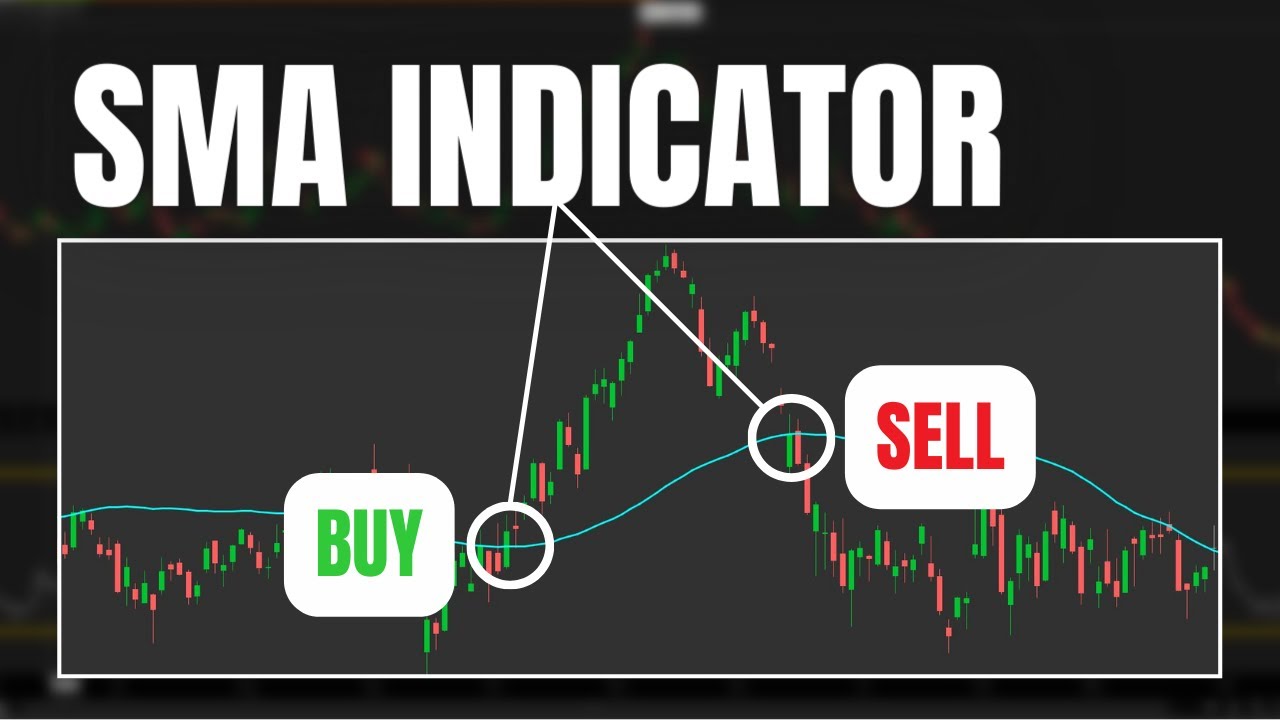
Simple Moving Average (SMA) Trading Indicator | How to Trade Simple Moving Average Crossovers
The Simple Moving Average, or SMA, is a popular technical indicator that can be used to find potential trend reversals. Throughout this video we’ll go over how the Simple Moving Average (SMA) is calculated, how it in can be used to find buy and sell sig
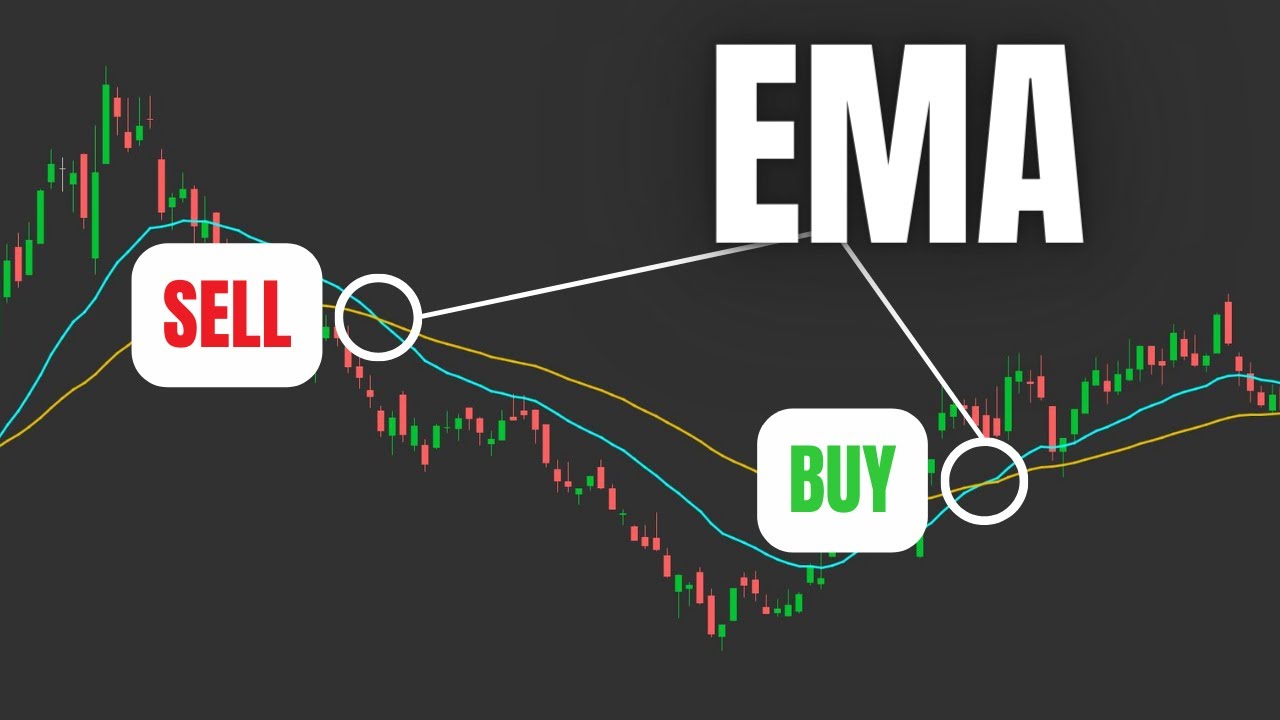
Exponential Moving Average (EMA) Trading Indicator | How to Trade using EMA
The Exponential Moving Average, or EMA, is a popular technical indicators that can be used to find potential trend reversals. Throughout this video we’ll go over how the EMA indicator is calculated, how it in can be used buy and sell signals, and how t