
Transform JSON to Interactive Graphs Online JSON to Graph Converter
Sep 8, 2024
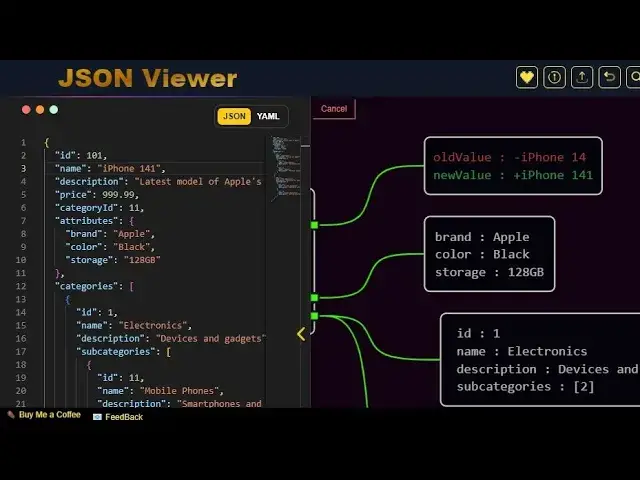
Welcome to our channel! In this video, we’ll show you how to turn your JSON data into dynamic and interactive graphs using jsonviewer.tools. Whether you're a data analyst, developer, or just looking to visualize your data in a new way, this tutorial is for you!
https://www.jsonviewer.tools
What You’ll Learn:
Introduction to JSON and jsonviewer.tools: Get an overview of JSON (JavaScript Object Notation) and how jsonviewer.tools can help you visualize it effectively.
Getting Started with jsonviewer.tools: A quick guide to accessing and navigating the features of jsonviewer.tools.
Step-by-Step Tutorial: Follow along as we demonstrate how to upload your JSON file, configure settings, and create interactive graphs.
Easy JSON data upload and parsing
Variety of interactive graph types
Customizable settings for graphs and charts
User-friendly interface for quick visualization
Additional Resources:
Thanks for watching, and happy data visualizing with jsonviewer.tools!
Show More Show Less