0:03
hello this is joshua parfitt the digital
0:06
and today we're going to walk you
0:08
through some simple steps to find out
0:09
the exact coronavirus statistics for
0:12
in the costa blanca in alicante and in
0:15
the entire valentin community
0:16
let's go the process is very simple
0:20
the health department in the valentin
0:21
community also known as sanitat
0:23
update their regional statistics every
0:25
day and they've provided an interactive
0:27
map for anybody who lives here
0:29
for free access to go on and find out
0:31
what the situation is in their community
0:33
with a number of parameters the address
0:37
dot san dot gva dot e
0:40
s forward slash and then you need to
0:51
now first of all we need to look at the
0:52
dates usually in spain the coronavirus
0:55
statistics come out between 5 and 6 pm
0:57
and then they are later updated for the
1:00
as you can see we are now looking at
1:02
yesterday's statistics which should be
1:03
fully updated since the beginning of the
1:05
state of alarm that came into effect on
1:08
what we have here on the left is a list
1:10
of all the municipalities
1:11
we have an interactive map of all the
1:13
municipalities that are colour
1:15
according to the severity of the
1:16
coronavirus outbreak situation there
1:18
and then over here on the right we have
1:20
certain statistics which are in
1:21
valencian however they do translate
1:23
quite easily here we have positives
1:25
here we have hospitalized the uthi are
1:28
people who are in intensive care
1:29
we have deaths we have uh patients cured
1:32
and we have active cases
1:34
now what you may be most interested in
1:36
is to look at your municipality
1:38
if we zoom in here we can start to see a
1:42
what we're looking at first is the
1:43
marina outer region now the marine outer
1:46
has been in the news recently as it was
1:48
the second best municipality in the
1:50
entire valencian community however
1:52
recently there have been resurgences of
1:54
certain coronavirus outbreaks in this
1:57
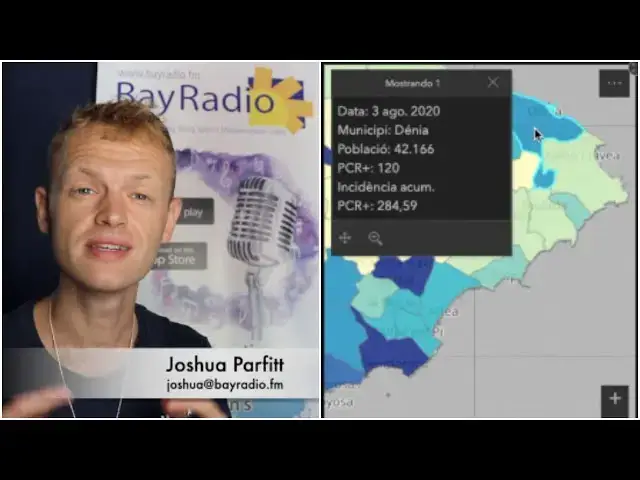
what we need to do to see those most
1:59
recent statistics is to click on your
2:01
in this case we have selected denia and
2:03
here at the bottom you can see
2:04
pcr which is the official testing
2:07
technique for coronavirus that takes
2:08
around four to six hours
2:09
and is the most trusted test at present
2:13
if you toggle to the right you can see
2:15
the pcr tests that have been conducted
2:18
you can see the color changes but now
2:20
when we click on it we can see
2:22
right here that there have been three
2:23
positive cases in denia
2:25
in the last 14 days up to the third of
2:28
if we move further down to alfaz del p
2:30
that has been in the news lately
2:31
we can see there have been five and if
2:33
we move down into benidorm we can see
2:35
that there have been 18
2:37
in the last 14 days in the same way if
2:40
living further down in alicante you can
2:42
just move further down towards torre
2:47
click on to riva and see that there have
2:50
the last 14 days now if you're feeling
2:54
like you'd like to investigate a little
2:56
this graph over here on the right is
2:59
if you click to enlarge it now we can
3:01
see the daily updates
3:03
of coronavirus positive by pcr deaths
3:06
and cured cases now as we can see here
3:09
at the beginning of the state of the
3:10
the most dominant statistic in the daily
3:14
coronavirus positives by pcr but now as
3:19
the so-called new normal you can start
3:20
to see that the cases in the valentine
3:22
community have been increasing
3:24
again at a near similar rate to back in
3:27
which has got many people worried that
3:28
we may be looking at further
3:31
now what is interesting to remember is
3:32
in the second outbreak the main number
3:35
are in the 20 to 30 to 40 age range
3:37
which means that the rates of
3:40
at this so-called second wave are not as
3:43
as they were back in march when the
3:46
average age of coronavirus patients was
3:48
up there in the 60s and 70s
3:56
and there is a very brief overview of
3:57
how to check out the coronavirus
3:59
statistics in your municipality
4:01
in spain's valencian community please
4:03
subscribe to our youtube channel
4:05
via links in the description below as we
4:07
shall be continuing to report on the
4:08
ongoing coronavirus situation
4:10
while mixing in interviews with experts
4:12
and many little tips and
4:14
tricks that you may not have known this
4:16
was joshua parfit for bay radio thank


