Up next in 10

Get a weight tracker here - https://arkiana.com/excel-weight-tracker/
Let's connect on Twitter - https://twitter.com/arkim_phiri
MORE SPREADSHEET TEMPLATES
Spreadsheet templates - https://payhip.com/hadlixe
Show More Show Less View Video Transcript
0:00
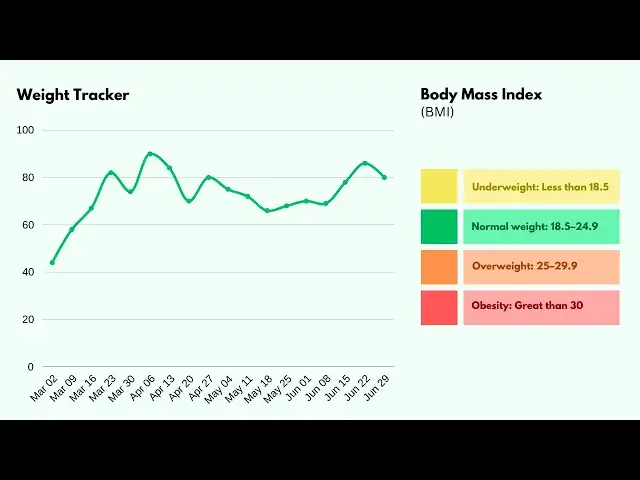
So in this video, we're going to make a weight tracker which will look something like this
0:04
So you have the depth there, you have your actual weight, your height, your body mass index and the status
0:10
So this status is based on the body mass index. So if your BMI is beyond 30, it will show a piece here
0:17
For example, if we change this one to 100, you can see the status changes as well
0:22
Then if your BMI is below 18.5, it will show that you are underweight
0:27
So let's change this one, let's say to 30. And you can see it says underweight here
0:32
So we're going to learn how we can find the BMI and how we can use conditional formatting for this status
0:38
You can also visualize your weight over time using this graph here
0:42
So this shows how your weight has been changing over time. For example, if we take back this to, let's say 70, you can see it's reflected here on the graph
0:52
So let's see how we can make this one. So to save some time, I've already created this table here
0:58
I've also gone ahead to add all the dates that we're going to use. So I'm going to assume that we're checking our weight weekly
1:04
So these dates are based on a weekly checkup. So first of all, we're going to format these dates
1:09
I'll go on the format here and I'll change it to long date here so that it's more clear like that
1:15
So this means that I'll be checking my weight every Saturday like so
1:19
Then let's try it for this one. So let's say the weight of 70 and the height is 1.69 meters like so
1:26
Now to calculate the body mass index, we need to divide the weight by the square of the height
1:31
So we're going to say equals weight here divided by, then in the brackets
1:37
I'll say height multiplied by height so that it becomes height squared like so
1:42
So this is our body mass index. I just leave it to two decimal places like so
1:48
Then for our status, we're going to be checking this body mass index value
1:53
If it is less than 18.5 here, we're going to say underweight
1:57
If it is above 30, we're going to say obese. So we're going to use the is function here
2:03
We'll say equals is. So for the logical test, we're going to say if this value is less than 18.5
2:11
then we're going to say underweight here. For the next test, we're going to look at this value again
2:17
So this time, we want it for the normal weight. If it's above 18.5, all the way to 24.9
2:24
So to do that, we're going to use the and function inside the is function
2:28
And we'll say if this value is greater than 18.5, the same value is less than 25
2:36
If this is the case, we're going to say normal. Then if it's above 25 to 29.9, so again, we'll use the and function
2:45
We'll say it's greater than 25. And this same value is less than 30
2:52
Then we're going to say overweight. By the way, this should be normal
2:57
And for the last condition, we're going to check if this value is greater than 30
3:03
And we're going to say obese. Then we'll close the is function
3:07
So just to quickly go through what we are saying here is, we're checking if this value is less than 18.5
3:14
If that's the case, we're going to say you're underweight. If this value is between 18.5 and 25, we're going to say the BMI is normal
3:23
If this value is above 25 but less than 30, we're going to say overweight
3:28
And if it's beyond 30, we're going to say obese. So just press enter
3:33
And here you can see because it's less than 25, we're going to say normal
3:37
So we can add another entry here. Let's say the weight increased to 76
3:42
The height is still at 1.69. And here we can just drag down the formula
3:47
You can see now this is beyond 25. So we expect the status to be overweight
3:52
So again, here I'll drag the formula. And we can see here it's overweight
3:56
So let me just quickly add in the weight and the height for the rest of this
4:00
Then we can just drag down the formula for the rest. OK, now that we have entered the weight and the height here
4:07
we can simply drag down the formula. And just double click here and the formula will be applied
4:12
Again, for the status, I'll do the same. There we go. Now the next thing we're going to do is to use conditional formatting
4:19
to highlight this status here. So when the status is normal, it should be highlighted in green
4:25
When it's obese, it should be highlighted in red. When it's underweight, it should be highlighted in yellow
4:30
So to do that, we just select everything. Then I'll click on conditional formatting here
4:36
Say highlight cell rows, then we'll go to echo tool. So here I'll type in normal
4:41
Then I'll choose from here, I'll choose green fill and click OK
4:45
So you can see everything that is normal is highlighted in green
4:49
I'll select this column once more. Go back to conditional formatting, highlight cell rows, then echo tool
4:56
This time around I'll choose overweight. And here I'll use the custom format
5:00
So for the fill, I'll choose this orange here. And for the font, I'll choose this one here and click OK
5:09
So you can see it's done there. Again, while this column is highlighted, I'll go back to conditional formatting, echo tool
5:16
Then this time around, I'll say obese, then I'll choose the dead fill and click OK
5:22
And finally, go back to the same one. This time around, I'll say underweight
5:27
Then I'll choose yellow from here and click OK. So if we are underweight, let's say this one is 40, for example
5:35
You can see this one becomes yellow like that. Now that we have this data for our weight
5:40
let's do a graph that shows how our weight changes over time
5:43
So just put the date and the weight. To do that, just highlight the date and the weight like so
5:50
Then go and insert here. Then you can choose what type of graph that you want
5:54
So I'll just click on this drop down here and I'll choose this 2D area like that
6:00
OK, let's just scroll down for more space. OK, so just click on this graph, right click, then go to format data series
6:09
click on the package here and in the field drop down, I'll just choose gradient
6:14
In the border, just choose a solid line and I'll leave it in black like that
6:19
Now we're able to see how our weight is changing over time
6:23
So if I change this back to say 80, so we can see how our graph is moving
6:29
So this will help us visualize how our weight is changing. At the moment, you can see it's increasing
6:35
and this will tell us that we need to keep our weight in check. So I'll leave a link to this weight tracker in the description below
6:41
If you want, you can download it for free. Thank you so much. I'll see you in the next one
#Weight Loss
#Health
#Obesity
#Nutrition